Royal Caribbean Cruise Lines 2009 Annual Report Download - page 42
Download and view the complete annual report
Please find page 42 of the 2009 Royal Caribbean Cruise Lines annual report below. You can navigate through the pages in the report by either clicking on the pages listed below, or by using the keyword search tool below to find specific information within the annual report.-
 1
1 -
2
-
3
-
4
-
5
-
6
-
7
-
8
-
9
-
10
-
11
-
12
-
13
-
14
-
15
-
16
-
17
-
18
-
19
-
20
-
21
-
22
-
23
-
24
-
25
-
26
-
27
-
28
-
29
-
30
-
31
-
 32
32 -
 33
33 -
 34
34 -
 35
35 -
 36
36 -
 37
37 -
 38
38 -
 39
39 -
 40
40 -
 41
41 -
 42
42 -
 43
43 -
 44
44 -
 45
45 -
 46
46 -
 47
47 -
 48
48 -
 49
49 -
 50
50 -
 51
51 -
 52
52 -
53
-
54
-
55
-
56
-
57
-
58
-
59
-
60
-
61
-
62
-
63
-
64
-
65
-
66
-
67
-
68
-
69
-
70
-
71
-
72
-
73
-
74
-
75
-
76
-
77
-
78
-
79
-
80
-
81
-
82
-
83
-
84
-
85
-
86
-
87
-
88
-
89
-
90
-
91
-
92
-
93
-
94
-
95
-
96
-
97
-
98
-
99
-
100
-
101
-
102
-
103
-
104
-
105
-
106
-
107
-
108
-
109
 |
 |

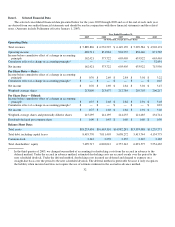
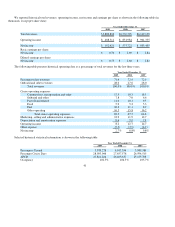
The selected consolidated financial data presented below for the years 2005 through 2009 and as of the end of each such year,
are derived from our audited financial statements and should be read in conjunction with those financial statements and the related
notes. (Amounts include Pullmantur effective January 1, 2007).
32
Item 6. Selected Financial Data
Year Ended December 31,
2009 2008 2007 2006 2005
(in thousands, exce
p
t
p
er share data)
O
p
eratin
g
Data:
Total revenues
$ 5,889,826
$ 6,532,525
$ 6,149,139
$ 5,229,584
$ 4,903,174
Operating income
488,511
831,984
901,335
858,446
871,565
Income before cumulative effect of a change in accounting
principle
162,421
573,722
603,405
633,922
663,465
Cumulative effect of a change in accounting principle
—
—
—
—
52,491
Net income
162,421
573,722
603,405
633,922
715,956
Per Share Data
—
Basic:
Income before cumulative effect of a change in accounting
principle
$0.76
$2.69
$2.84
$3.01
$3.22
Cumulative effect of a change in accounting principle
$
—
$
—
$
—
$
—
$0.25
Net income
$0.76
$2.69
$2.84
$3.01
$3.47
Weighte
d
-average shares
213,809
213,477
212,784
210,703
206,217
Per Share Data
—
Diluted:
Income before cumulative effect of a change in accounting
principle
$0.75
$2.68
$2.82
$2.94
$3.03
Cumulative effect of a change in accounting principle
$—
$—
$—
$—
$0.22
Net income
$0.75
$2.68
$2.82
$2.94
$3.26
Weighte
d
-average shares and potentially dilutive shares
215,295
214,195
214,255
221,485
234,714
Dividends declared per common share
$0.00
$0.45
$0.60
$0.60
$0.56
Balance Sheet Data:
Total assets
$18,233,494
$16,463,310
$14,982,281
$13,393,088
$11,255,771
Total debt, including capital leases
8,419,770
7,011,403
5,698,272
5,413,744
4,154,775
Common stock
2,243
2,239
2,235
2,225
2,165
Total shareholders’ equity
7,499,717
6,803,012
6,757,343
6,091,575
5,554,465
In the third quarter of 2005, we changed our method of accounting for drydocking costs from the accrual in advance to the
deferral method. Under the accrual in advance method, estimated drydocking costs are accrued evenly over the period to the
next scheduled drydock. Under the deferral method, drydocking costs incurred are deferred and charged to expense on a
straight-line basis over the period to the next scheduled drydock. The deferral method is preferable because it only recognizes
the liability when incurred and does not require the use of estimates inherent in the accrual in advance method.
1
1
1
1