Royal Caribbean Cruise Lines 2009 Annual Report Download - page 52
Download and view the complete annual report
Please find page 52 of the 2009 Royal Caribbean Cruise Lines annual report below. You can navigate through the pages in the report by either clicking on the pages listed below, or by using the keyword search tool below to find specific information within the annual report.-
 1
1 -
2
-
3
-
4
-
5
-
6
-
7
-
8
-
9
-
10
-
11
-
12
-
13
-
14
-
15
-
16
-
17
-
18
-
19
-
20
-
21
-
22
-
23
-
24
-
25
-
26
-
27
-
28
-
29
-
30
-
31
-
32
-
33
-
34
-
35
-
36
-
37
-
38
-
39
-
40
-
41
-
 42
42 -
 43
43 -
 44
44 -
 45
45 -
 46
46 -
 47
47 -
 48
48 -
 49
49 -
 50
50 -
 51
51 -
 52
52 -
 53
53 -
 54
54 -
 55
55 -
 56
56 -
 57
57 -
 58
58 -
 59
59 -
 60
60 -
 61
61 -
 62
62 -
63
-
64
-
65
-
66
-
67
-
68
-
69
-
70
-
71
-
72
-
73
-
74
-
75
-
76
-
77
-
78
-
79
-
80
-
81
-
82
-
83
-
84
-
85
-
86
-
87
-
88
-
89
-
90
-
91
-
92
-
93
-
94
-
95
-
96
-
97
-
98
-
99
-
100
-
101
-
102
-
103
-
104
-
105
-
106
-
107
-
108
-
109
 |
 |

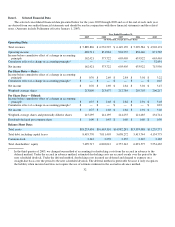
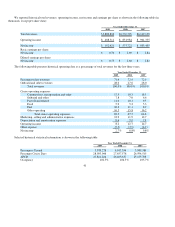
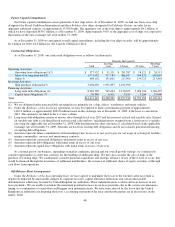
Gross Yields and Net Yields were calculated as follows (in thousands, except APCD and Yields):
Gross Cruise Costs and Net Cruise Costs were calculated as follows (in thousands, except APCD and costs per APCD):
Net Debt-to-Capital was calculated as follows (in thousands):
42
Year Ended December 31,
2009 2008 2007
Passenger ticket revenues
$4,205,709
$4,730,289
$4,427,384
Onboard and other revenues
1,684,117
1,802,236
1,721,755
Total revenues
5,889,826
6,532,525
6,149,139
Less:
Commissions, transportation and other
1,028,867
1,192,316
1,124,022
Onboard and other
457,772
458,385
405,637
Net revenues
$4,403,187
$4,881,824
$4,619,480
APCD
27,821,224
26,463,637
25,155,768
Gross Yields
$211.70
$246.85
$244.44
Net Yields
$ 158.27
$ 184.47
$ 183.64
Year Ended December 31
,
2009 2008 2007
Total cruise operating expenses
$4,071,102
$4,403,666
$3,981,698
Marketing, selling and administrative expenses
761,999
776,522
783,040
Gross Cruise Costs
4,833,101
5,180,188
4,764,738
Less:
Commissions, transportation and other
1,028,867
1,192,316
1,124,022
Onboard and other
457,772
458,385
405,637
Net Cruise Costs
$3,346,462
$3,529,487
$3,235,079
APCD
27,821,224
26,463,637
25,155,768
Gross Cruise Costs per APCD
$173.72
$195.75
$189.41
Net Cruise Costs per APCD
$ 120.28
$ 133.37
$ 128.60
As of
December 31,
2009 2008
Long-term debt, net of current portion
$7,663,555
$6,539,510
Current portion of long-term debt
756,215
471,893
Total debt
8,419,770
7,011,403
Less: Cash and cash equivalents
284,619
402,878
Net Deb
t
$8,135,151 $ 6,608,525
Total shareholders’ equity
$ 7,499,717
$ 6,803,012
Total debt
8,419,770
7,011,403
Total debt and shareholders’ equity
15,919,487
13,814,415
Debt-to-Capital
52.9% 50.8%
Net Debt
8,135,151
6,608,525
Net Debt and shareholders’ equity
$15,634,868
$13,411,537
Net Deb
t
-to-Capital
52.0%
49.3%