Royal Caribbean Cruise Lines 2009 Annual Report Download - page 91
Download and view the complete annual report
Please find page 91 of the 2009 Royal Caribbean Cruise Lines annual report below. You can navigate through the pages in the report by either clicking on the pages listed below, or by using the keyword search tool below to find specific information within the annual report.-
 1
1 -
2
-
3
-
4
-
5
-
6
-
7
-
8
-
9
-
10
-
11
-
12
-
13
-
14
-
15
-
16
-
17
-
18
-
19
-
20
-
21
-
22
-
23
-
24
-
25
-
26
-
27
-
28
-
29
-
30
-
31
-
32
-
33
-
34
-
35
-
36
-
37
-
38
-
39
-
40
-
41
-
42
-
43
-
44
-
45
-
46
-
47
-
48
-
49
-
50
-
51
-
52
-
53
-
54
-
55
-
56
-
57
-
58
-
59
-
60
-
61
-
62
-
63
-
64
-
65
-
66
-
67
-
68
-
69
-
70
-
71
-
72
-
73
-
74
-
75
-
76
-
77
-
78
-
79
-
80
-
 81
81 -
 82
82 -
 83
83 -
 84
84 -
 85
85 -
 86
86 -
 87
87 -
 88
88 -
 89
89 -
 90
90 -
 91
91 -
 92
92 -
 93
93 -
 94
94 -
 95
95 -
 96
96 -
 97
97 -
 98
98 -
 99
99 -
 100
100 -
 101
101 -
102
-
103
-
104
-
105
-
106
-
107
-
108
-
109
 |
 |

ROYAL CARIBBEAN CRUISES LTD.
NOTES TO THE CONSOLIDATED FINANCIAL STATEMENTS—(Continued)
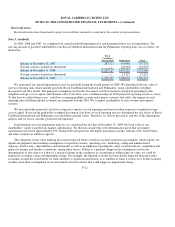
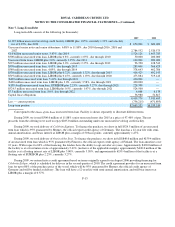
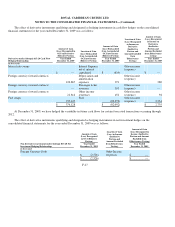
Stock options activity and information about stock options outstanding are summarized in the following tables:
The weighted-average estimated fair value of stock options granted was $3.68, $8.72 and $12.93 during the years ended
December 31, 2009, 2008 and 2007, respectively. The total intrinsic value of stock options exercised during the years ended
December 31, 2009, 2008 and 2007 was $0.5 million, $2.0 million and $16.8 million, respectively. As of December 31, 2009, there
was approximately $5.2 million of total unrecognized compensation cost, net of estimated forfeitures, related to stock options granted
under our stock incentive plans which is expected to be recognized over a weighted-average period of 1.4 years.
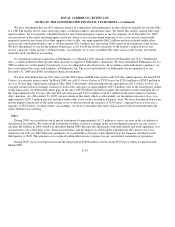
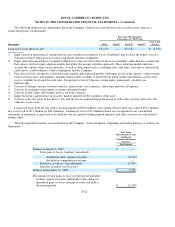
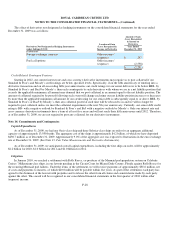
Restricted stock units are converted into shares of common stock upon vesting on a one-for-one basis. The cost of these awards
is determined using the fair value of our common stock on the date of the grant, and compensation expense is recognized over the
vesting period. Restricted stock activity is summarized in the following table:
The weighted-average estimated fair value of restricted stock units granted during the year ended December 31, 2008, and 2007
were $36.24 and $44.43, respectively. As of December 31, 2009, we had $6.7 million of total unrecognized compensation expense,
net of estimated forfeitures, related to restricted stock unit grants, which will be recognized over the weighted-average period of 1.6
years.
F-18
Stock O
p
tions Activit
y
Number of
O
p
tions
Weighted-
Average
Exercise
Price
Weighted-
Average
Remaining
Contractual
Term
Aggregate
Intrinsic
Value
(
y
ears) (in thousands)
Outstanding at January 1, 2009
6,646,159 $ 34.44
5.38
$2,933
Granted
1,829,720
$7.63
Exercised
(49,076)
$11.60
Canceled
(958,309)
$37.47
Outstanding at December 31, 2009
7,468,494 $ 27.77
5.92
$44,047
Vested and expected to vest at December 31, 2009
6,607,307
$28.97
5.55
$35,243
Options Exercisable at December 31, 2009
4,019,727
$33.18
3.64
$12,741
The intrinsic value represents the amount by which the fair value of stock exceeds the option exercise price as of December 31,
2009.
Restricted Stock Activit
y
Number of
Awards
Weighted-
Average
Grant Date
Fair Value
Non-vested share units at January 1, 2009
862,734
$36.24
Granted
926,827
$7.68
Vested
(259,291)
$38.26
Canceled
(32,053)
$34.48
Non-vested share units expected to vest at December 31, 2009
1,498,217
$18.26
1
1