Royal Caribbean Cruise Lines 2009 Annual Report Download - page 78
Download and view the complete annual report
Please find page 78 of the 2009 Royal Caribbean Cruise Lines annual report below. You can navigate through the pages in the report by either clicking on the pages listed below, or by using the keyword search tool below to find specific information within the annual report.-
 1
1 -
2
-
3
-
4
-
5
-
6
-
7
-
8
-
9
-
10
-
11
-
12
-
13
-
14
-
15
-
16
-
17
-
18
-
19
-
20
-
21
-
22
-
23
-
24
-
25
-
26
-
27
-
28
-
29
-
30
-
31
-
32
-
33
-
34
-
35
-
36
-
37
-
38
-
39
-
40
-
41
-
42
-
43
-
44
-
45
-
46
-
47
-
48
-
49
-
50
-
51
-
52
-
53
-
54
-
55
-
56
-
57
-
58
-
59
-
60
-
61
-
62
-
63
-
64
-
65
-
66
-
67
-
 68
68 -
 69
69 -
 70
70 -
 71
71 -
 72
72 -
 73
73 -
 74
74 -
 75
75 -
 76
76 -
 77
77 -
 78
78 -
 79
79 -
 80
80 -
 81
81 -
 82
82 -
 83
83 -
 84
84 -
 85
85 -
 86
86 -
 87
87 -
 88
88 -
89
-
90
-
91
-
92
-
93
-
94
-
95
-
96
-
97
-
98
-
99
-
100
-
101
-
102
-
103
-
104
-
105
-
106
-
107
-
108
-
109
 |
 |

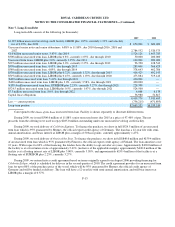
ROYAL CARIBBEAN CRUISES LTD.
CONSOLIDATED STATEMENTS OF CASH FLOWS
The accompanying notes are an integral part of these consolidated financial statements.
F-5
Year Ended December 31,
2009 2008 2007
(in thousands)
O
p
eratin
g
Activities
Net income
$ 162,421
$ 573,722
$ 603,405
Adjustments:
Depreciation and amortization
568,214 520,353
483,066
Changes in operating assets and liabilities:
(Increase) decrease in trade and other receivables, net
(3,633)
28,150
(122,682)
Increase in inventories
(11,295)
(140)
(19,424)
(Increase) decrease in prepaid expenses and other assets
(3,085)
12,884
(37,650)
Increase in accounts payable
16,424
22,322
23,398
Increase (decrease) in accrued interest
18,668
(3,571)
78,160
Increase in accrued expenses and other liabilities
15,391 39,766
72,035
Increase (decrease) in customer deposits
32,038
(118,541)
184,713
Other, ne
t
49,738
(3,690)
3,673
Net cash provided by operating activities
844,881
1,071,255
1,268,694
Investin
g
Activities
Purchases of property and equipment
(2,477,549)
(2,223,534)
(1,317,381)
Repayment of notes from TUI Travel
—
—
100,000
Cash received on settlement of derivative financial instruments
110,830
269,815
59,392
Loans and equity contributions to unconsolidated affiliates
(181,683)
(52,323)
—
Proceeds from sale of Celebrit
y
Galax
y
290,928
—
—
Proceeds from sale of investment in Island Cruises
—
51,400
—
Other, ne
t
(16,983)
(22,607)
(12,569)
Net cash used in investing activities
(2,274,457)
(1,977,249)
(1,170,558)
Financin
g
Activities
Proceeds from issuance of deb
t
2,317,158
2,223,402
1,934,979
Debt issuance costs
(61,157)
(23,872)
(10,146)
Repayments of debt
(948,467)
(987,547)
(1,805,798)
Dividends paid
—
(128,045)
(98,298)
Proceeds from exercise of common stock options
569
3,817
19,632
Other, ne
t
4,103
(4,369)
(3,758)
Net cash provided by financing activities
1,312,206
1,083,386
36,611
Effect of exchange rate changes on cash
(889)
(5,298)
(8,483)
Net (decrease) increase in cash and cash equivalents
(118,259)
172,094
126,264
Cash and cash equivalents at beginning of year
402,878
230,784
104,520
Cash and cash equivalents at end of year
$284,619
$402,878
$230,784
Su
pp
lemental Disclosures
Cash paid during the year for:
Interest, net of amount capitalized
$ 288,458
$ 321,206
$ 285,206
Non-cash Investin
g
Transactions
We accrued for purchases of property and equipment paid in 2009
$—
$ 63,857
$—