Royal Caribbean Cruise Lines 2009 Annual Report Download - page 56
Download and view the complete annual report
Please find page 56 of the 2009 Royal Caribbean Cruise Lines annual report below. You can navigate through the pages in the report by either clicking on the pages listed below, or by using the keyword search tool below to find specific information within the annual report.-
 1
1 -
2
-
3
-
4
-
5
-
6
-
7
-
8
-
9
-
10
-
11
-
12
-
13
-
14
-
15
-
16
-
17
-
18
-
19
-
20
-
21
-
22
-
23
-
24
-
25
-
26
-
27
-
28
-
29
-
30
-
31
-
32
-
33
-
34
-
35
-
36
-
37
-
38
-
39
-
40
-
41
-
42
-
43
-
44
-
45
-
 46
46 -
 47
47 -
 48
48 -
 49
49 -
 50
50 -
 51
51 -
 52
52 -
 53
53 -
 54
54 -
 55
55 -
 56
56 -
 57
57 -
 58
58 -
 59
59 -
 60
60 -
 61
61 -
 62
62 -
 63
63 -
 64
64 -
 65
65 -
 66
66 -
67
-
68
-
69
-
70
-
71
-
72
-
73
-
74
-
75
-
76
-
77
-
78
-
79
-
80
-
81
-
82
-
83
-
84
-
85
-
86
-
87
-
88
-
89
-
90
-
91
-
92
-
93
-
94
-
95
-
96
-
97
-
98
-
99
-
100
-
101
-
102
-
103
-
104
-
105
-
106
-
107
-
108
-
109
 |
 |

Marketing, Selling and Administrative Expenses
Marketing, selling and administrative expenses for 2008 decreased $6.5 million or 0.8% to $776.5 million from $783.0 million
for 2007. The decrease was primarily due to the cost savings initiative announced during the third quarter to reduce spending along
with a change in the employee forfeiture rate assumption related to our stock-based employee compensation plans that resulted in a
benefit of approximately $8.2 million in the second quarter of 2008. As part of the cost savings initiative, we eliminated
approximately 400 shore-side positions during the third quarter of 2008. The decrease due to the cost savings initiative was partially
offset by termination benefits of $9.0 million, related to the same initiative and increases in headcount and other costs associated with
personnel during the first six months of 2008.
Depreciation and Amortization Expenses
Depreciation and amortization expenses for 2008 increased $37.3 million or 7.7% to $520.4 million from $483.1 million for the
same period in 2007. This increase is primarily due to the addition of Independence of the Seas, which entered service in May 2008, a
full year of Liberty of the Seas, which entered service in May 2007, and the addition of Ocean Dream, which entered service in March
2008.
Other Income (Expense)
Interest expense, net of interest capitalized, decreased to $327.3 million in 2008 from $333.8 million in 2007. Gross interest
expense decreased to $371.7 million in 2008 from $373.7 million in 2007. The decrease was primarily due to lower interest rates,
partially offset by a higher average debt level. Interest capitalized increased to $44.4 million in 2008 from $39.9 million in 2007
primarily due to a higher average level of investment in ships under construction.
Other income increased to $54.9 million in 2008 from $15.8 million in 2007. The increase was due to $23.0 million in foreign
currency exchange gains in 2008 as compared to $6.7 million in foreign currency exchange losses in 2007, for a net change of $29.7
million when comparing these periods. The increase was also due to a $17.6 million settlement received in the case against Pentair
Water Treatment (OH) Company (formerly known as Essef Corporation). These increases were partially offset by a gain of $18.5
million in 2007 related to certain derivatives instruments associated with our ship construction firm commitments denominated in
euros that did not qualify for hedge accounting treatment which did not recur in 2008.
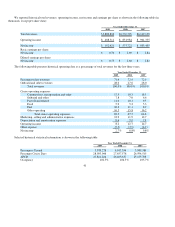
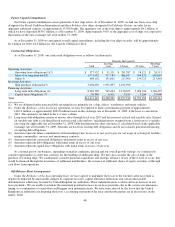
Net Yields
Net Yields increased 0.5% in 2008 compared to the same period in 2007 primarily due to increases in ticket prices as mentioned
above. Occupancy in 2008 was 104.5% compared to 105.7% in 2007.
Net Cruise Costs
Net Cruise Costs increased 9.1% in 2008 compared to 2007 due to the 5.2% increase in capacity mentioned above and a 3.7%
increase in Net Cruise Costs per APCD. The increase in Net Cruise Costs per APCD was primarily driven by increases in fuel
expenses, and to a lesser extent, payroll and related expenses related to shipboard employees. These increases were partially offset by
the decrease in marketing, selling and administrative expenses as mentioned above. Fuel expenses represented 4.3 percentage points
of the overall increase in Net Cruise Costs per APCD.
Restructuring Initiatives
On July 21, 2008, we announced a cost savings initiative expected to save approximately $125.0 million of general and
administrative expenses annually. This initiative was a response to the reduction in our profitability. As part of this initiative, we
eliminated approximately 400 shore-side positions. In addition, we discontinued some non-core operations, including The Scholar
Ship. The elimination of the shore-side positions and the discontinuation of non-core operations were concluded by the end of the
third quarter of 2008.
46