Royal Caribbean Cruise Lines 2009 Annual Report Download - page 41
Download and view the complete annual report
Please find page 41 of the 2009 Royal Caribbean Cruise Lines annual report below. You can navigate through the pages in the report by either clicking on the pages listed below, or by using the keyword search tool below to find specific information within the annual report.-
 1
1 -
2
-
3
-
4
-
5
-
6
-
7
-
8
-
9
-
10
-
11
-
12
-
13
-
14
-
15
-
16
-
17
-
18
-
19
-
20
-
21
-
22
-
23
-
24
-
25
-
26
-
27
-
28
-
29
-
30
-
 31
31 -
 32
32 -
 33
33 -
 34
34 -
 35
35 -
 36
36 -
 37
37 -
 38
38 -
 39
39 -
 40
40 -
 41
41 -
 42
42 -
 43
43 -
 44
44 -
 45
45 -
 46
46 -
 47
47 -
 48
48 -
 49
49 -
 50
50 -
 51
51 -
52
-
53
-
54
-
55
-
56
-
57
-
58
-
59
-
60
-
61
-
62
-
63
-
64
-
65
-
66
-
67
-
68
-
69
-
70
-
71
-
72
-
73
-
74
-
75
-
76
-
77
-
78
-
79
-
80
-
81
-
82
-
83
-
84
-
85
-
86
-
87
-
88
-
89
-
90
-
91
-
92
-
93
-
94
-
95
-
96
-
97
-
98
-
99
-
100
-
101
-
102
-
103
-
104
-
105
-
106
-
107
-
108
-
109
 |
 |
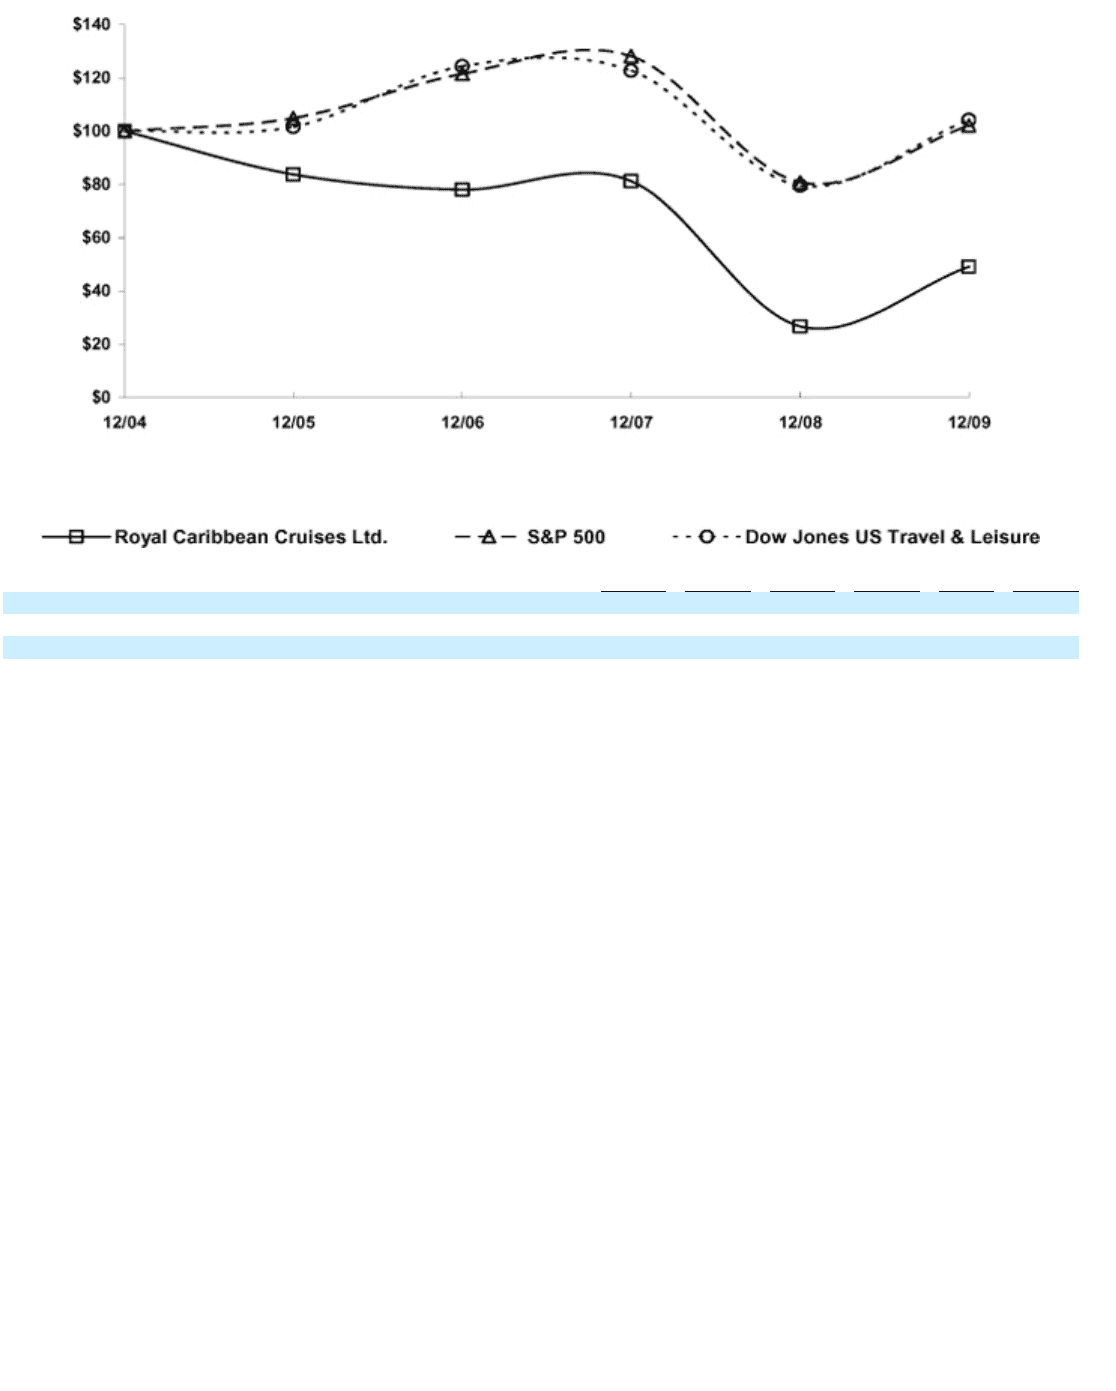
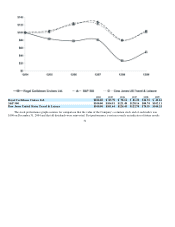
The stock performance graph assumes for comparison that the value of the Company’s common stock and of each index was
$100 on December 31, 2004 and that all dividends were reinvested. Past performance is not necessarily an indicator of future results.
31
12/04 12/05 12/06 12/07 12/08 12/09
Ro
y
al Caribbean Cruises Ltd.
$100.00
$83.79
$78.11
$81.29
$26.74
$49.16
S&P 500
$100.00
$104.91
$121.48
$128.16
$80.74
$102.11
Dow Jones United States Travel & Leisure
$100.00
$101.64
$124.45
$122.70
$79.59
$104.25