Pottery Barn 2012 Annual Report Download - page 75
Download and view the complete annual report
Please find page 75 of the 2012 Pottery Barn annual report below. You can navigate through the pages in the report by either clicking on the pages listed below, or by using the keyword search tool below to find specific information within the annual report.-
 1
1 -
2
-
3
-
4
-
5
-
6
-
7
-
8
-
9
-
10
-
11
-
12
-
13
-
14
-
15
-
16
-
17
-
18
-
19
-
20
-
21
-
22
-
23
-
24
-
25
-
26
-
27
-
28
-
29
-
30
-
31
-
32
-
33
-
34
-
35
-
36
-
37
-
38
-
39
-
40
-
41
-
42
-
43
-
44
-
45
-
46
-
47
-
48
-
49
-
50
-
51
-
52
-
53
-
54
-
55
-
56
-
57
-
58
-
59
-
60
-
61
-
62
-
63
-
64
-
 65
65 -
 66
66 -
 67
67 -
 68
68 -
 69
69 -
 70
70 -
 71
71 -
 72
72 -
 73
73 -
 74
74 -
 75
75 -
 76
76 -
 77
77 -
 78
78 -
 79
79 -
 80
80 -
 81
81 -
 82
82 -
 83
83 -
 84
84 -
 85
85 -
86
-
87
-
88
-
89
-
90
-
91
-
92
-
93
-
94
-
95
-
96
-
97
-
98
-
99
-
100
-
101
-
102
-
103
-
104
-
105
-
106
-
107
-
108
-
109
-
110
-
111
-
112
-
113
-
114
-
115
-
116
-
117
-
118
-
119
-
120
-
121
-
122
-
123
-
124
-
125
-
126
-
127
-
128
-
129
-
130
-
131
-
132
-
133
-
134
-
135
-
136
-
137
-
138
-
139
-
140
-
141
-
142
-
143
-
144
-
145
-
146
-
147
-
148
-
149
-
150
-
151
-
152
-
153
-
154
-
155
-
156
-
157
-
158
-
159
-
160
 |
 |

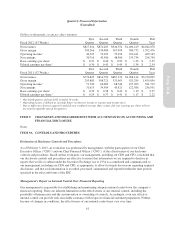
Quarterly Financial Information
(Unaudited)
Dollars in thousands, except per share amounts
Fiscal 2012 (53 Weeks)
First
Quarter
Second
Quarter
Third
Quarter
Fourth
Quarter1
Full
Year
Net revenues $817,614 $874,283 $944,554 $1,406,419 $4,042,870
Gross margin 309,266 334,480 367,998 580,732 1,592,476
Operating income249,323 70,103 79,296 210,441 409,163
Net earnings 30,716 43,380 48,900 133,734 256,730
Basic earnings per share3$ 0.31 $ 0.44 $ 0.50 $ 1.36 $ 2.59
Diluted earnings per share3$ 0.30 $ 0.43 $ 0.49 $ 1.34 $ 2.54
Fiscal 2011 (52 Weeks)
First
Quarter
Second
Quarter
Third
Quarter
Fourth
Quarter
Full
Year
Net revenues $770,825 $814,750 $867,176 $1,268,144 $3,720,895
Gross margin 295,883 308,721 331,963 523,289 1,459,856
Operating income251,700 64,085 68,744 197,203 381,732
Net earnings 31,615 39,309 43,421 122,586 236,931
Basic earnings per share3$ 0.30 $ 0.38 $ 0.42 $ 1.19 $ 2.27
Diluted earnings per share3$ 0.29 $ 0.37 $ 0.41 $ 1.17 $ 2.22
1Our fourth quarter of fiscal 2012 included 14 weeks.
2Operating income is defined as earnings before net interest income or expense and income taxes.
3Due to differences between quarterly and full year weighted average share counts, full year earnings per share will not
necessarily equal the sum of the quarters.
ITEM 9. CHANGES IN AND DISAGREEMENTS WITH ACCOUNTANTS ON ACCOUNTING AND
FINANCIAL DISCLOSURE
None.
ITEM 9A. CONTROLS AND PROCEDURES
Evaluation of Disclosure Controls and Procedures
As of February 3, 2013, an evaluation was performed by management, with the participation of our Chief
Executive Officer (“CEO”) and our Chief Financial Officer (“CFO”), of the effectiveness of our disclosure
controls and procedures. Based on that evaluation, our management, including our CEO and CFO, concluded that
our disclosure controls and procedures are effective to ensure that information we are required to disclose in
reports that we file or submit under the Securities Exchange Act of 1934 is accumulated and communicated to
our management, including our CEO and CFO, as appropriate, to allow for timely discussions regarding required
disclosures, and that such information is recorded, processed, summarized and reported within the time periods
specified in the rules and forms of the SEC.
Management’s Report on Internal Control Over Financial Reporting
Our management is responsible for establishing and maintaining adequate internal control over the company’s
financial reporting. There are inherent limitations in the effectiveness of any internal control, including the
possibility of human error and the circumvention or overriding of controls. Accordingly, even any effective
internal control can provide only reasonable assurance with respect to financial statement preparation. Further,
because of changes in conditions, the effectiveness of any internal control may vary over time.
61
Form 10-K