Pottery Barn 2012 Annual Report Download - page 68
Download and view the complete annual report
Please find page 68 of the 2012 Pottery Barn annual report below. You can navigate through the pages in the report by either clicking on the pages listed below, or by using the keyword search tool below to find specific information within the annual report.-
 1
1 -
2
-
3
-
4
-
5
-
6
-
7
-
8
-
9
-
10
-
11
-
12
-
13
-
14
-
15
-
16
-
17
-
18
-
19
-
20
-
21
-
22
-
23
-
24
-
25
-
26
-
27
-
28
-
29
-
30
-
31
-
32
-
33
-
34
-
35
-
36
-
37
-
38
-
39
-
40
-
41
-
42
-
43
-
44
-
45
-
46
-
47
-
48
-
49
-
50
-
51
-
52
-
53
-
54
-
55
-
56
-
57
-
 58
58 -
 59
59 -
 60
60 -
 61
61 -
 62
62 -
 63
63 -
 64
64 -
 65
65 -
 66
66 -
 67
67 -
 68
68 -
 69
69 -
 70
70 -
 71
71 -
 72
72 -
 73
73 -
 74
74 -
 75
75 -
 76
76 -
 77
77 -
 78
78 -
79
-
80
-
81
-
82
-
83
-
84
-
85
-
86
-
87
-
88
-
89
-
90
-
91
-
92
-
93
-
94
-
95
-
96
-
97
-
98
-
99
-
100
-
101
-
102
-
103
-
104
-
105
-
106
-
107
-
108
-
109
-
110
-
111
-
112
-
113
-
114
-
115
-
116
-
117
-
118
-
119
-
120
-
121
-
122
-
123
-
124
-
125
-
126
-
127
-
128
-
129
-
130
-
131
-
132
-
133
-
134
-
135
-
136
-
137
-
138
-
139
-
140
-
141
-
142
-
143
-
144
-
145
-
146
-
147
-
148
-
149
-
150
-
151
-
152
-
153
-
154
-
155
-
156
-
157
-
158
-
159
-
160
 |
 |

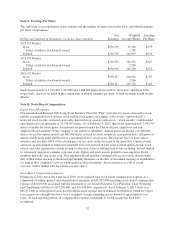
The fair value of option awards is estimated on the date of the grant using the Black-Scholes option pricing
model with the following weighted-average assumptions:
•Expected term – The expected term of the option awards represents the period of time between the grant
date of the option awards and the date the option awards are either exercised, converted or cancelled,
including an estimate for those option awards still outstanding.
•Expected volatility – The expected volatility is based on an average of the historical volatility of our
stock price, for a period approximating our expected term, and the implied volatility of externally traded
options of our stock during the period.
•Risk-free interest rate – The risk-free interest rate is based on the U.S. Treasury yield curve in effect at
the time of grant and with a maturity that approximates our expected term.
•Dividend yield – The dividend yield is based on our quarterly cash dividend and the anticipated dividend
payout over our expected term.
No option awards were granted in fiscal 2012. The weighted average assumptions used for fiscal 2011 and fiscal
2010 are as follows:
Fiscal Year Ended
Jan. 29, 2012 Jan. 30, 2011
Expected term (years) 5.0 5.1
Expected volatility 46.6% 47.3%
Risk-free interest rate 2.2% 2.6%
Dividend yield 2.3% 2.2%
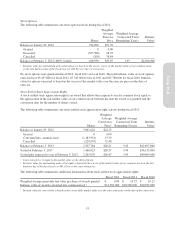
Restricted Stock Units
The following table summarizes our restricted stock unit activity during fiscal 2012:
Shares
Weighted
Average
Grant Date
Fair Value
Weighted Average
Contractual Term
Remaining (Years)
Intrinsic
Value1
Balance at January 29, 2012 2,293,851 $29.74
Granted 1,276,183 37.94
Released (432,929) 21.91
Cancelled (364,679) 30.67
Balance at February 3, 2013 2,772,426 $34.61 2.27 $124,815,000
Vested plus expected to vest at February 3, 2013 1,956,461 $34.67 2.27 $ 88,080,000
1Intrinsic value for outstanding and unvested restricted stock units is based on the market value of our common stock on the
last business day of the fiscal year (or $45.02).
The following table summarizes additional information about restricted stock units:
Fiscal 2012 Fiscal 2011 Fiscal 2010
Weighted average grant date fair value per share of awards granted $ 37.94 $ 39.27 $ 28.13
Intrinsic value of awards released 1$16,730,000 $12,865,000 $32,109,000
1Intrinsic value for releases is based on the market value on the date of release.
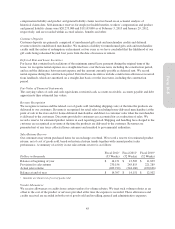
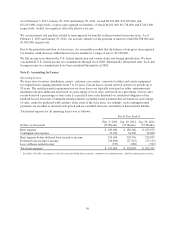
Tax Effect
We present tax benefits resulting from the exercise of stock-based awards as operating cash flows in the
Consolidated Statements of Cash Flows. Tax deductions in excess of the cumulative compensation cost
recognized for stock-based awards exercised are presented as a financing cash inflow and an operating cash
outflow. During fiscal 2012, fiscal 2011 and fiscal 2010, net proceeds from the exercise of stock-based awards
54