Pottery Barn 2012 Annual Report Download - page 55
Download and view the complete annual report
Please find page 55 of the 2012 Pottery Barn annual report below. You can navigate through the pages in the report by either clicking on the pages listed below, or by using the keyword search tool below to find specific information within the annual report.-
 1
1 -
2
-
3
-
4
-
5
-
6
-
7
-
8
-
9
-
10
-
11
-
12
-
13
-
14
-
15
-
16
-
17
-
18
-
19
-
20
-
21
-
22
-
23
-
24
-
25
-
26
-
27
-
28
-
29
-
30
-
31
-
32
-
33
-
34
-
35
-
36
-
37
-
38
-
39
-
40
-
41
-
42
-
43
-
44
-
 45
45 -
 46
46 -
 47
47 -
 48
48 -
 49
49 -
 50
50 -
 51
51 -
 52
52 -
 53
53 -
 54
54 -
 55
55 -
 56
56 -
 57
57 -
 58
58 -
 59
59 -
 60
60 -
 61
61 -
 62
62 -
 63
63 -
 64
64 -
 65
65 -
66
-
67
-
68
-
69
-
70
-
71
-
72
-
73
-
74
-
75
-
76
-
77
-
78
-
79
-
80
-
81
-
82
-
83
-
84
-
85
-
86
-
87
-
88
-
89
-
90
-
91
-
92
-
93
-
94
-
95
-
96
-
97
-
98
-
99
-
100
-
101
-
102
-
103
-
104
-
105
-
106
-
107
-
108
-
109
-
110
-
111
-
112
-
113
-
114
-
115
-
116
-
117
-
118
-
119
-
120
-
121
-
122
-
123
-
124
-
125
-
126
-
127
-
128
-
129
-
130
-
131
-
132
-
133
-
134
-
135
-
136
-
137
-
138
-
139
-
140
-
141
-
142
-
143
-
144
-
145
-
146
-
147
-
148
-
149
-
150
-
151
-
152
-
153
-
154
-
155
-
156
-
157
-
158
-
159
-
160
 |
 |

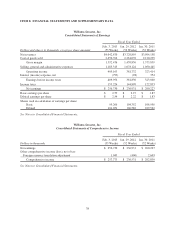
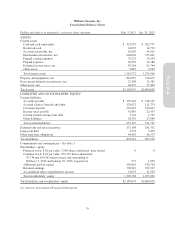
Williams-Sonoma, Inc.
Consolidated Statements of Cash Flows
Fiscal Year Ended
Dollars in thousands
Feb. 3, 2013
(53 Weeks)
Jan. 29, 2012
(52 Weeks)
Jan. 30, 2011
(52 Weeks)
Cash flows from operating activities:
Net earnings $ 256,730 $ 236,931 $ 200,227
Adjustments to reconcile net earnings to net cash provided by (used in)
operating activities:
Depreciation and amortization 134,453 130,553 144,630
(Gain)/loss on sale/disposal of assets 2,317 2,040 (1,139)
Impairment of assets 6,071 840 5,453
Amortization of deferred lease incentives (26,694) (27,547) (37,115)
Deferred income taxes (9,029) 14,210 23,566
Tax benefit from exercise of stock-based awards 12,725 8,515 10,450
Excess tax benefit from exercise of stock-based awards (12,683) (8,021) (11,239)
Stock-based compensation expense 31,042 24,336 26,630
Other 017 0
Changes in:
Accounts receivable (16,408) (4,763) 3,477
Merchandise inventories (85,981) (34,853) (46,464)
Prepaid catalog expenses (2,937) 2,559 (4,048)
Prepaid expenses and other assets (12,204) (2,065) (1,729)
Accounts payable 22,461 (21,154) 35,946
Accrued salaries, benefits and other current and long-term liabilities 9,147 (16,030) 19,314
Customer deposits 16,962 (2,242) (3,112)
Deferred rent and lease incentives 18,803 7,570 (2,550)
Income taxes payable 19,352 (19,562) (6,308)
Net cash provided by operating activities 364,127 291,334 355,989
Cash flows from investing activities:
Purchases of property and equipment (205,404) (130,353) (61,906)
Restricted cash deposits (1,323) (2,220) (12,512)
Proceeds from sale of assets 182 81 10,823
Proceeds from insurance reimbursement 115 751 0
Acquisition of Rejuvenation Inc., net of cash received 0 (25,363) 0
Other (385) (600) (400)
Net cash used in investing activities (206,815) (157,704) (63,995)
Cash flows from financing activities:
Repurchase of common stock (155,080) (194,429) (125,000)
Payment of dividends (87,847) (68,877) (59,160)
Tax withholdings related to stock-based awards (18,637) (11,656) (17,918)
Net proceeds from exercise of stock-based awards 14,637 9,614 15,736
Excess tax benefit from exercise of stock-based awards 12,683 8,021 11,239
Repayments of long-term obligations (1,796) (1,626) (1,587)
Other (405) (86) (1,625)
Net cash used in financing activities (236,445) (259,039) (178,315)
Effect of exchange rates on cash and cash equivalents 931 (237) 781
Net increase (decrease) in cash and cash equivalents (78,202) (125,646) 114,460
Cash and cash equivalents at beginning of year 502,757 628,403 513,943
Cash and cash equivalents at end of year $ 424,555 $ 502,757 $ 628,403
Supplemental disclosure of cash flow information:
Cash paid during the year for:
Interest $ 1,651 $ 1,952 $ 2,381
Income taxes, net of refunds 131,440 150,657 98,617
See Notes to Consolidated Financial Statements.
41
Form 10-K