Pottery Barn 2012 Annual Report Download - page 120
Download and view the complete annual report
Please find page 120 of the 2012 Pottery Barn annual report below. You can navigate through the pages in the report by either clicking on the pages listed below, or by using the keyword search tool below to find specific information within the annual report.-
 1
1 -
2
-
3
-
4
-
5
-
6
-
7
-
8
-
9
-
10
-
11
-
12
-
13
-
14
-
15
-
16
-
17
-
18
-
19
-
20
-
21
-
22
-
23
-
24
-
25
-
26
-
27
-
28
-
29
-
30
-
31
-
32
-
33
-
34
-
35
-
36
-
37
-
38
-
39
-
40
-
41
-
42
-
43
-
44
-
45
-
46
-
47
-
48
-
49
-
50
-
51
-
52
-
53
-
54
-
55
-
56
-
57
-
58
-
59
-
60
-
61
-
62
-
63
-
64
-
65
-
66
-
67
-
68
-
69
-
70
-
71
-
72
-
73
-
74
-
75
-
76
-
77
-
78
-
79
-
80
-
81
-
82
-
83
-
84
-
85
-
86
-
87
-
88
-
89
-
90
-
91
-
92
-
93
-
94
-
95
-
96
-
97
-
98
-
99
-
100
-
101
-
102
-
103
-
104
-
105
-
106
-
107
-
108
-
109
-
 110
110 -
 111
111 -
 112
112 -
 113
113 -
 114
114 -
 115
115 -
 116
116 -
 117
117 -
 118
118 -
 119
119 -
 120
120 -
 121
121 -
 122
122 -
 123
123 -
 124
124 -
 125
125 -
 126
126 -
 127
127 -
 128
128 -
 129
129 -
 130
130 -
131
-
132
-
133
-
134
-
135
-
136
-
137
-
138
-
139
-
140
-
141
-
142
-
143
-
144
-
145
-
146
-
147
-
148
-
149
-
150
-
151
-
152
-
153
-
154
-
155
-
156
-
157
-
158
-
159
-
160
 |
 |

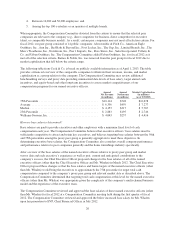
4. Between 14,000 and 56,000 employees; and
5. Among the top 100 e-retailers or an operator of multiple brands.
When appropriate, the Compensation Committee deviated from the criteria to ensure that the selected peer
companies are relevant to the company (e.g., direct competitor for business, direct competitor for executive
talent, or comparable business model). As a result, certain peer companies may not meet all selection criteria. For
fiscal 2012, our peer group consisted of 14 public companies: Abercrombie & Fitch Co., American Eagle
Outfitters, Inc., Ann Inc., Bed Bath & Beyond Inc., Foot Locker, Inc., The Gap, Inc., Limited Brands, Inc., The
Men’s Wearhouse, Inc., Nordstrom, Inc., Pier 1 Imports, Inc., Ross Stores, Inc., Saks Incorporated, Tiffany &
Co. and Urban Outfitters, Inc. The Compensation Committee added Urban Outfitters, Inc. for fiscal 2012 as it
met all of the selection criteria. Barnes & Noble, Inc. was removed from the peer group for fiscal 2012 due to
market capitalization that fell below the criteria range.
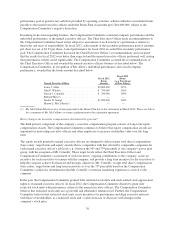
The following table from Cook & Co. is based on publicly available information as of April 1, 2013. The table
provides a financial overview of the comparable companies to illustrate their revenues, income, and market
capitalization as a group relative to the company. The Compensation Committee may review additional
benchmarking surveys and proxy data providing summarized data levels of base salary, target annual cash
incentives, and equity-based and other long-term incentives to assess market competitiveness of our
compensation programs for our named executive officers.
Annual
Net Revenue
(in millions)
Annual
Net Income
(in millions)
Market Capitalization
(in millions)
(as of 2/3/2013)
75th Percentile ........................................ $10,114 $748 $12,678
Average ............................................. $ 6,336 $459 $ 7,277
Median .............................................. $ 4,153 $317 $ 5,767
25th Percentile ........................................ $ 2,883 $195 $ 2,746
Williams-Sonoma, Inc. ................................. $ 4,043 $257 $ 4,416
How are base salaries determined?
Base salaries are paid to provide executives and other employees with a minimum fixed level of cash
compensation each year. The Compensation Committee believes that executive officers’ base salaries must be
sufficiently competitive to attract and retain key executives, and believes targeting base salaries between the 50th
and 75th percentiles among the proxy peer group is generally appropriate to meet these objectives. In
determining executive base salaries, the Compensation Committee also considers overall company performance
and performance relative to peer companies generally and the home furnishings industry specifically.
After a review of the base salaries of the named executive officers relative to proxy peer group and market
survey data and each executive’s experience as well as past, current and anticipated contributions to the
company’s success, the Chief Executive Officer proposed changes to the base salaries of all of the named
executive officers (other than the Chief Executive Officer and Ms. Whalen) in March 2012. The Chief Executive
Officer proposed these changes so that the base salaries and bonus targets of the named executive officers (other
than Ms. Whalen) would bring the executives to approximately the 75th percentile for target total cash
compensation compared to the company’s proxy peer group and relevant market data as described above. The
Compensation Committee determined that targeting total cash compensation at this level for the named executive
officers (other than Ms. Whalen) was appropriate given the complexity of the company’s multi-channel business
model and the experience of the executive team.
The Compensation Committee reviewed and approved the base salaries of these named executive officers (other
than Ms. Whalen) for fiscal 2012 at a Compensation Committee meeting held during the first quarter of fiscal
2012. The Compensation Committee reviewed and approved the below increased base salary for Ms. Whalen
upon her promotion to EVP, Chief Financial Officer in July 2012.
26