Pottery Barn 2012 Annual Report Download - page 52
Download and view the complete annual report
Please find page 52 of the 2012 Pottery Barn annual report below. You can navigate through the pages in the report by either clicking on the pages listed below, or by using the keyword search tool below to find specific information within the annual report.-
 1
1 -
2
-
3
-
4
-
5
-
6
-
7
-
8
-
9
-
10
-
11
-
12
-
13
-
14
-
15
-
16
-
17
-
18
-
19
-
20
-
21
-
22
-
23
-
24
-
25
-
26
-
27
-
28
-
29
-
30
-
31
-
32
-
33
-
34
-
35
-
36
-
37
-
38
-
39
-
40
-
41
-
 42
42 -
 43
43 -
 44
44 -
 45
45 -
 46
46 -
 47
47 -
 48
48 -
 49
49 -
 50
50 -
 51
51 -
 52
52 -
 53
53 -
 54
54 -
 55
55 -
 56
56 -
 57
57 -
 58
58 -
 59
59 -
 60
60 -
 61
61 -
 62
62 -
63
-
64
-
65
-
66
-
67
-
68
-
69
-
70
-
71
-
72
-
73
-
74
-
75
-
76
-
77
-
78
-
79
-
80
-
81
-
82
-
83
-
84
-
85
-
86
-
87
-
88
-
89
-
90
-
91
-
92
-
93
-
94
-
95
-
96
-
97
-
98
-
99
-
100
-
101
-
102
-
103
-
104
-
105
-
106
-
107
-
108
-
109
-
110
-
111
-
112
-
113
-
114
-
115
-
116
-
117
-
118
-
119
-
120
-
121
-
122
-
123
-
124
-
125
-
126
-
127
-
128
-
129
-
130
-
131
-
132
-
133
-
134
-
135
-
136
-
137
-
138
-
139
-
140
-
141
-
142
-
143
-
144
-
145
-
146
-
147
-
148
-
149
-
150
-
151
-
152
-
153
-
154
-
155
-
156
-
157
-
158
-
159
-
160
 |
 |

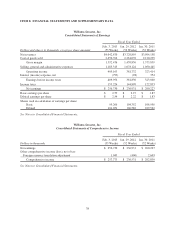
ITEM 8. FINANCIAL STATEMENTS AND SUPPLEMENTARY DATA
Williams-Sonoma, Inc.
Consolidated Statements of Earnings
Fiscal Year Ended
Dollars and shares in thousands, except per share amounts
Feb. 3, 2013
(53 Weeks)
Jan. 29, 2012
(52 Weeks)
Jan. 30, 2011
(52 Weeks)
Net revenues $4,042,870 $3,720,895 $3,504,158
Cost of goods sold 2,450,394 2,261,039 2,130,299
Gross margin 1,592,476 1,459,856 1,373,859
Selling, general and administrative expenses 1,183,313 1,078,124 1,050,445
Operating income 409,163 381,732 323,414
Interest (income) expense, net (793) (98) 354
Earnings before income taxes 409,956 381,830 323,060
Income taxes 153,226 144,899 122,833
Net earnings $ 256,730 $ 236,931 $ 200,227
Basic earnings per share $ 2.59 $ 2.27 $ 1.87
Diluted earnings per share $ 2.54 $ 2.22 $ 1.83
Shares used in calculation of earnings per share:
Basic 99,266 104,352 106,956
Diluted 101,051 106,582 109,522
See Notes to Consolidated Financial Statements.
Williams-Sonoma, Inc.
Consolidated Statements of Comprehensive Income
Fiscal Year Ended
Dollars in thousands
Feb. 3, 2013
(53 Weeks)
Jan. 29, 2012
(52 Weeks)
Jan. 30, 2011
(52 Weeks)
Net earnings $ 256,730 $ 236,931 $ 200,227
Other comprehensive income (loss), net of tax:
Foreign currency translation adjustment 1,043 (400) 2,603
Comprehensive income $ 257,773 $ 236,531 $ 202,830
See Notes to Consolidated Financial Statements.
38