Pottery Barn 2012 Annual Report Download - page 46
Download and view the complete annual report
Please find page 46 of the 2012 Pottery Barn annual report below. You can navigate through the pages in the report by either clicking on the pages listed below, or by using the keyword search tool below to find specific information within the annual report.-
 1
1 -
2
-
3
-
4
-
5
-
6
-
7
-
8
-
9
-
10
-
11
-
12
-
13
-
14
-
15
-
16
-
17
-
18
-
19
-
20
-
21
-
22
-
23
-
24
-
25
-
26
-
27
-
28
-
29
-
30
-
31
-
32
-
33
-
34
-
35
-
 36
36 -
 37
37 -
 38
38 -
 39
39 -
 40
40 -
 41
41 -
 42
42 -
 43
43 -
 44
44 -
 45
45 -
 46
46 -
 47
47 -
 48
48 -
 49
49 -
 50
50 -
 51
51 -
 52
52 -
 53
53 -
 54
54 -
 55
55 -
 56
56 -
57
-
58
-
59
-
60
-
61
-
62
-
63
-
64
-
65
-
66
-
67
-
68
-
69
-
70
-
71
-
72
-
73
-
74
-
75
-
76
-
77
-
78
-
79
-
80
-
81
-
82
-
83
-
84
-
85
-
86
-
87
-
88
-
89
-
90
-
91
-
92
-
93
-
94
-
95
-
96
-
97
-
98
-
99
-
100
-
101
-
102
-
103
-
104
-
105
-
106
-
107
-
108
-
109
-
110
-
111
-
112
-
113
-
114
-
115
-
116
-
117
-
118
-
119
-
120
-
121
-
122
-
123
-
124
-
125
-
126
-
127
-
128
-
129
-
130
-
131
-
132
-
133
-
134
-
135
-
136
-
137
-
138
-
139
-
140
-
141
-
142
-
143
-
144
-
145
-
146
-
147
-
148
-
149
-
150
-
151
-
152
-
153
-
154
-
155
-
156
-
157
-
158
-
159
-
160
 |
 |
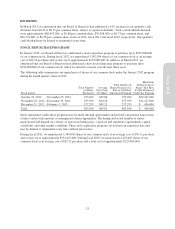
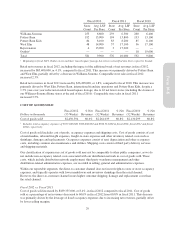
Cash Flows from Operating Activities
In fiscal 2012, net cash provided by operating activities was $364,127,000 compared to $291,334,000 in fiscal
2011. Net cash provided by operating activities in fiscal 2012 was primarily attributable to net earnings after non-
cash adjustments and an increase in accounts payable, partially offset by an increase in merchandise inventories.
Net cash provided by operating activities in fiscal 2012 increased compared to fiscal 2011 primarily due to the
timing of payments associated with accounts payable and accrued salaries, benefits and other expenses, and an
increase in income taxes payable and customer deposits, partially offset by an increase in inventory purchases.
In fiscal 2011, net cash provided by operating activities was $291,334,000 compared to $355,989,000 in fiscal
2010. Net cash provided by operating activities in fiscal 2011 was primarily attributable to net earnings. Net cash
provided by operating activities in fiscal 2011 decreased compared to fiscal 2010 primarily due to a decrease in
accounts payable and accrued liabilities and a decrease in income taxes payable, partially offset by an increase in
fiscal 2011 net earnings.
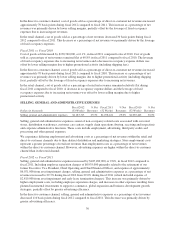
Cash Flows from Investing Activities
Net cash used in investing activities was $206,815,000 for fiscal 2012 compared to $157,704,000 in fiscal 2011.
Fiscal 2012 purchases of property and equipment were $205,404,000, comprised of $76,479,000 for 21 new and 9
remodeled or expanded stores, $67,077,000 for systems development projects (including e-commerce websites),
and $61,848,000 for distribution center and other infrastructure projects. Net cash used in investing activities for
fiscal 2012 increased compared to fiscal 2011 primarily due to an increase in purchases of property and equipment.
Net cash used in investing activities was $157,704,000 for fiscal 2011 compared to $63,995,000 in fiscal 2010.
Fiscal 2011 purchases of property and equipment were $130,353,000, comprised of $53,679,000 for systems
development projects (including e-commerce websites), $42,263,000 for 5 new and 12 remodeled or expanded
stores and $34,411,000 for distribution center and other infrastructure projects. Net cash used in investing
activities for fiscal 2011 increased compared to fiscal 2010 primarily due to an increase in purchases of property
and equipment, as well as our acquisition of Rejuvenation in the fourth quarter of fiscal 2011.
Cash Flows from Financing Activities
For fiscal 2012, net cash used in financing activities was $236,445,000 compared to $259,039,000 in fiscal 2011.
Net cash used in financing activities in fiscal 2012 was primarily attributable to repurchases of common stock of
$155,080,000 and the payment of dividends of $87,847,000. Net cash used in financing activities in fiscal 2012
decreased compared to fiscal 2011 primarily due to a decrease in our repurchase of common stock, partially
offset by an increase in the payment of dividends.
For fiscal 2011, net cash used in financing activities was $259,039,000 compared to $178,315,000 in fiscal 2010.
Net cash used in financing activities in fiscal 2011 was primarily attributable to repurchases of common stock of
$194,429,000 and the payment of dividends of $68,877,000. Net cash used in financing activities in fiscal 2011
increased compared to fiscal 2010 primarily due to an increase in our repurchase of common stock.
Dividends
See section titled Dividends within Part II, Item 5 of this Annual Report on Form 10-K for further information.
Stock Repurchase Programs
See section titled Stock Repurchase Programs within Part II, Item 5 of this Annual Report on Form 10-K for
further information.
32