Pottery Barn 2012 Annual Report Download - page 71
Download and view the complete annual report
Please find page 71 of the 2012 Pottery Barn annual report below. You can navigate through the pages in the report by either clicking on the pages listed below, or by using the keyword search tool below to find specific information within the annual report.-
 1
1 -
2
-
3
-
4
-
5
-
6
-
7
-
8
-
9
-
10
-
11
-
12
-
13
-
14
-
15
-
16
-
17
-
18
-
19
-
20
-
21
-
22
-
23
-
24
-
25
-
26
-
27
-
28
-
29
-
30
-
31
-
32
-
33
-
34
-
35
-
36
-
37
-
38
-
39
-
40
-
41
-
42
-
43
-
44
-
45
-
46
-
47
-
48
-
49
-
50
-
51
-
52
-
53
-
54
-
55
-
56
-
57
-
58
-
59
-
60
-
 61
61 -
 62
62 -
 63
63 -
 64
64 -
 65
65 -
 66
66 -
 67
67 -
 68
68 -
 69
69 -
 70
70 -
 71
71 -
 72
72 -
 73
73 -
 74
74 -
 75
75 -
 76
76 -
 77
77 -
 78
78 -
 79
79 -
 80
80 -
 81
81 -
82
-
83
-
84
-
85
-
86
-
87
-
88
-
89
-
90
-
91
-
92
-
93
-
94
-
95
-
96
-
97
-
98
-
99
-
100
-
101
-
102
-
103
-
104
-
105
-
106
-
107
-
108
-
109
-
110
-
111
-
112
-
113
-
114
-
115
-
116
-
117
-
118
-
119
-
120
-
121
-
122
-
123
-
124
-
125
-
126
-
127
-
128
-
129
-
130
-
131
-
132
-
133
-
134
-
135
-
136
-
137
-
138
-
139
-
140
-
141
-
142
-
143
-
144
-
145
-
146
-
147
-
148
-
149
-
150
-
151
-
152
-
153
-
154
-
155
-
156
-
157
-
158
-
159
-
160
 |
 |

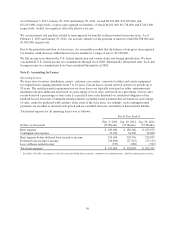
advertising and employment costs, to the extent they have been determined to benefit both channels. These
operating segments are aggregated at the channel level for reporting purposes due to the fact that our brands are
interdependent for economies of scale and we do not maintain fully allocated income statements at the brand
level. As a result, material financial decisions related to the brands are made at the channel level. Furthermore, it
is not practicable for us to report revenue by product group.
We use operating income to evaluate segment profitability. Operating income is defined as earnings (loss) before
net interest income or expense and income taxes. Unallocated costs before interest and income taxes include
corporate employee-related costs, occupancy expenses (including depreciation expense), administrative costs and
third party service costs, primarily in our corporate systems, corporate facilities and other administrative
departments. Unallocated assets include corporate cash and cash equivalents, deferred income taxes, the net book
value of corporate facilities and related information systems, and other corporate long-lived assets.
Income tax information by reportable segment has not been included as taxes are calculated at a company-wide
level and are not allocated to each reportable segment.
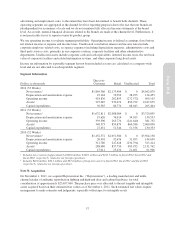
Segment Information
Dollars in thousands
Direct-to-
Customer Retail Unallocated Total
2012 (53 Weeks)
Net revenues1$1,869,386 $2,173,484 $ 0 $4,042,870
Depreciation and amortization expense 23,164 72,994 38,295 134,453
Operating income 418,836 262,899 (272,572) 409,163
Assets2397,285 939,672 850,722 2,187,679
Capital expenditures 30,585 86,776 88,043 205,404
2011 (52 Weeks)
Net revenues1$1,632,811 $2,088,084 $ 0 $3,720,895
Depreciation and amortization expense 19,626 76,914 34,013 130,553
Operating income 359,596 263,776 (241,640) 381,732
Assets2340,573 859,879 860,386 2,060,838
Capital expenditures 27,451 51,546 51,356 130,353
2010 (52 Weeks)
Net revenues1$1,452,572 $2,051,586 $ 0 $3,504,158
Depreciation and amortization expense 20,901 92,676 31,053 144,630
Operating income 312,780 247,428 (236,794) 323,414
Assets2288,080 857,750 985,932 2,131,762
Capital expenditures 15,011 25,434 21,461 61,906
1Includes net revenues of approximately $166.6 million, $140.1 million and $113.7 million in fiscal 2012, fiscal 2011 and
fiscal 2010, respectively, related to our foreign operations.
2Includes $42.6 million, $24.1 million and $27.0 million of long-term assets in fiscal 2012, fiscal 2011 and fiscal 2010,
respectively, related to our foreign operations.
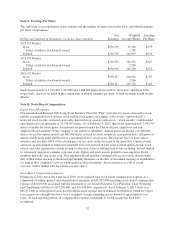
Note N: Acquisition
On November 1, 2011, we acquired Rejuvenation Inc. (“Rejuvenation”), a leading manufacturer and multi-
channel retailer of authentic reproduction lighting and high-end door and cabinet hardware, for total
consideration of approximately $25,657,000. The purchase price was allocated to the net tangible and intangible
assets acquired based on their estimated fair values as of November 1, 2011. Such estimated fair values require
management to make estimates and judgments, especially with respect to intangible assets.
57
Form 10-K