Pottery Barn 2012 Annual Report Download - page 39
Download and view the complete annual report
Please find page 39 of the 2012 Pottery Barn annual report below. You can navigate through the pages in the report by either clicking on the pages listed below, or by using the keyword search tool below to find specific information within the annual report.-
 1
1 -
2
-
3
-
4
-
5
-
6
-
7
-
8
-
9
-
10
-
11
-
12
-
13
-
14
-
15
-
16
-
17
-
18
-
19
-
20
-
21
-
22
-
23
-
24
-
25
-
26
-
27
-
28
-
 29
29 -
 30
30 -
 31
31 -
 32
32 -
 33
33 -
 34
34 -
 35
35 -
 36
36 -
 37
37 -
 38
38 -
 39
39 -
 40
40 -
 41
41 -
 42
42 -
 43
43 -
 44
44 -
 45
45 -
 46
46 -
 47
47 -
 48
48 -
 49
49 -
50
-
51
-
52
-
53
-
54
-
55
-
56
-
57
-
58
-
59
-
60
-
61
-
62
-
63
-
64
-
65
-
66
-
67
-
68
-
69
-
70
-
71
-
72
-
73
-
74
-
75
-
76
-
77
-
78
-
79
-
80
-
81
-
82
-
83
-
84
-
85
-
86
-
87
-
88
-
89
-
90
-
91
-
92
-
93
-
94
-
95
-
96
-
97
-
98
-
99
-
100
-
101
-
102
-
103
-
104
-
105
-
106
-
107
-
108
-
109
-
110
-
111
-
112
-
113
-
114
-
115
-
116
-
117
-
118
-
119
-
120
-
121
-
122
-
123
-
124
-
125
-
126
-
127
-
128
-
129
-
130
-
131
-
132
-
133
-
134
-
135
-
136
-
137
-
138
-
139
-
140
-
141
-
142
-
143
-
144
-
145
-
146
-
147
-
148
-
149
-
150
-
151
-
152
-
153
-
154
-
155
-
156
-
157
-
158
-
159
-
160
 |
 |

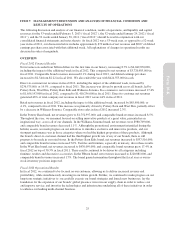
ITEM 7. MANAGEMENT’S DISCUSSION AND ANALYSIS OF FINANCIAL CONDITION AND
RESULTS OF OPERATIONS
The following discussion and analysis of our financial condition, results of operations, and liquidity and capital
resources for the 53 weeks ended February 3, 2013 (“fiscal 2012”), the 52 weeks ended January 29, 2012 (“fiscal
2011”), and the 52 weeks ended January 30, 2011 (“fiscal 2010”) should be read in conjunction with our
consolidated financial statements and notes thereto. As fiscal 2012 was a 53-week year, as opposed to a 52-week
year in fiscal 2011, our discussion below includes approximately $70 million of net revenues and $0.07 of diluted
earnings per share associated with that additional week. All explanations of changes in operational results are
discussed in order of magnitude.
OVERVIEW
Fiscal 2012 Financial Results
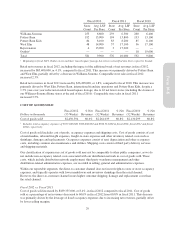
Net revenues exceeded four billion dollars for the first time in our history, increasing 8.7% to $4,042,870,000,
including the impact of the additional week in fiscal 2012. This compared to net revenues of $3,720,895,000 in
fiscal 2011. Comparable brand revenues increased 6.1% during fiscal 2012, and diluted earnings per share
increased to $2.54 from $2.22 in fiscal 2011. We also ended the year with $424,555,000 in cash.
Direct-to-customer net revenues in fiscal 2012, including the impact of the additional week, increased by
$236,575,000, or 14.5%, compared to fiscal 2011. This increase was driven by growth across all brands, led by
Pottery Barn, West Elm, Pottery Barn Kids and Williams-Sonoma. In e-commerce, net revenues increased 17.4%
to $1,656,197,000 in fiscal 2012, compared to $1,410,236,000 in fiscal 2011. Direct-to-customer net revenues
generated 46% of total company net revenues in fiscal 2012 versus 44% in fiscal 2011.
Retail net revenues in fiscal 2012, including the impact of the additional week, increased by $85,400,000, or
4.1%, compared to fiscal 2011. This increase was primarily driven by Pottery Barn and West Elm, partially offset
by a decrease in Williams-Sonoma. Comparable store sales in fiscal 2012 increased 2.3%.
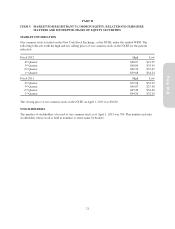
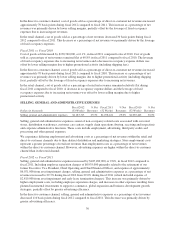
In the Pottery Barn brand, net revenues grew to $1,752,997,000, and comparable brand revenues increased 8.5%.
Throughout the year, we remained focused on selling innovative products at a great value, presented in an
inspirational way, across all of our channels. In the Williams-Sonoma brand, net revenues were $980,709,000,
and comparable brand revenues decreased 1.1%. Although the promotional environment intensified during the
holiday season, we made progress on our initiatives to introduce exclusive and innovative products, and our
strongest performance was in those categories where we had the highest proportion of these products. Although
the brand’s direct-to-customer channel had the third highest growth rate of any of our brands, there is still
progress to be made in our retail stores. In the Pottery Barn Kids brand, net revenues increased to $557,516,000,
and comparable brand revenues increased 5.6%. Textiles and furniture, especially in nursery, drove these results.
In the West Elm brand, net revenues increased to $430,099,000, and comparable brand revenues grew 17.4% in
fiscal 2012 on top of 30.3% in fiscal 2011. These results continued to be driven by all categories including
furniture, textiles and decorative accessories. In the PBteen brand, net revenues increased to $220,081,000, and
comparable brand revenues increased 1.7%. The brand gained momentum throughout the fiscal year as our in-
stock inventory positions improved.
Fiscal 2012 Operational Results
In fiscal 2012, we continued to be focused on our customer, allowing us to deliver increased revenue and
profitability, while simultaneously investing in our future growth. Further, we continued to make progress on our
long-term strategic initiatives to: successfully execute our brand strategies and launch new businesses; lay the
foundation for the expansion of our brands’ global presence; invest in our supply chain in order to reduce cost
and improve service; and invest in the technologies and infrastructure underlying all of these initiatives in order
to enhance our leading multi-channel business.
25
Form 10-K