Pottery Barn 2012 Annual Report Download - page 42
Download and view the complete annual report
Please find page 42 of the 2012 Pottery Barn annual report below. You can navigate through the pages in the report by either clicking on the pages listed below, or by using the keyword search tool below to find specific information within the annual report.-
 1
1 -
2
-
3
-
4
-
5
-
6
-
7
-
8
-
9
-
10
-
11
-
12
-
13
-
14
-
15
-
16
-
17
-
18
-
19
-
20
-
21
-
22
-
23
-
24
-
25
-
26
-
27
-
28
-
29
-
30
-
31
-
 32
32 -
 33
33 -
 34
34 -
 35
35 -
 36
36 -
 37
37 -
 38
38 -
 39
39 -
 40
40 -
 41
41 -
 42
42 -
 43
43 -
 44
44 -
 45
45 -
 46
46 -
 47
47 -
 48
48 -
 49
49 -
 50
50 -
 51
51 -
 52
52 -
53
-
54
-
55
-
56
-
57
-
58
-
59
-
60
-
61
-
62
-
63
-
64
-
65
-
66
-
67
-
68
-
69
-
70
-
71
-
72
-
73
-
74
-
75
-
76
-
77
-
78
-
79
-
80
-
81
-
82
-
83
-
84
-
85
-
86
-
87
-
88
-
89
-
90
-
91
-
92
-
93
-
94
-
95
-
96
-
97
-
98
-
99
-
100
-
101
-
102
-
103
-
104
-
105
-
106
-
107
-
108
-
109
-
110
-
111
-
112
-
113
-
114
-
115
-
116
-
117
-
118
-
119
-
120
-
121
-
122
-
123
-
124
-
125
-
126
-
127
-
128
-
129
-
130
-
131
-
132
-
133
-
134
-
135
-
136
-
137
-
138
-
139
-
140
-
141
-
142
-
143
-
144
-
145
-
146
-
147
-
148
-
149
-
150
-
151
-
152
-
153
-
154
-
155
-
156
-
157
-
158
-
159
-
160
 |
 |

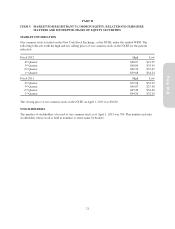
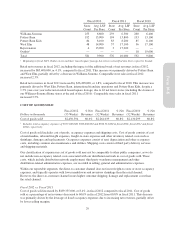
Percentages represent changes in comparable brand revenue compared to the same period in the prior year.
Comparable brand revenue growth (decline)
Fiscal 2012
(53 Weeks)
Fiscal 2011
(52 Weeks)
Fiscal 2010
(52 Weeks)
Pottery Barn 8.5% 7.6% 17.7%
Williams-Sonoma1(1.1%) 0.0% 5.7%
Pottery Barn Kids 5.6% 7.4% 16.4%
West Elm 17.4% 30.3% 20.8%
PBteen 1.7% 7.4% 21.1%
Total 6.1% 7.3% 13.9%
1Williams-Sonoma excludes net revenues from Williams-Sonoma Home merchandise. Including Williams-Sonoma Home,
comparable brand revenue growth (decline) for Williams-Sonoma was (1.7%), (0.3%) and 5.0% in fiscal 2012, fiscal 2011
and fiscal 2010, respectively. Williams-Sonoma Home net revenues, however, are included in the total.
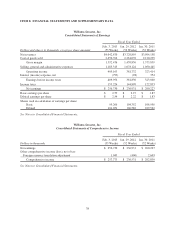
DIRECT-TO-CUSTOMER NET REVENUES
Dollars in thousands
Fiscal 2012
(53 Weeks)
Fiscal 2011
(52 Weeks)
Fiscal 2010
(52 Weeks)
Direct-to-customer net revenues $1,869,386 $1,632,811 $1,452,572
Direct-to-customer net revenue growth 14.5% 12.4% 18.6%
E-commerce net revenue growth 17.4% 17.9% 26.9%
E-commerce net revenues as a percent of direct-to-customer net
revenues 88.6% 86.4% 82.4%
Direct-to-customer net revenues in fiscal 2012, including the impact of the additional week of net revenues in
fiscal 2012, increased by $236,575,000, or 14.5%, compared to fiscal 2011. This increase was driven by growth
across all brands, led by Pottery Barn, West Elm, Pottery Barn Kids and Williams-Sonoma. In e-commerce, net
revenues increased 17.4% to $1,656,197,000 in fiscal 2012, compared to $1,410,236,000 in fiscal 2011. Direct-
to-customer net revenues generated 46% of total company net revenues in fiscal 2012 versus 44% in fiscal 2011.
Direct-to-customer net revenues in fiscal 2011 increased by $180,239,000, or 12.4%, compared to fiscal 2010.
This increase was driven by 17.9% growth in e-commerce net revenues in fiscal 2011 compared to fiscal 2010.
Increased net revenues during fiscal 2011 were driven by growth across all brands, led by Pottery Barn, West
Elm and Pottery Barn Kids.
RETAIL NET REVENUES AND OTHER DATA
Dollars in thousands
Fiscal 2012
(53 Weeks)
Fiscal 2011
(52 Weeks)
Fiscal 2010
(52 Weeks)
Retail net revenues $2,173,484 $2,088,084 $2,051,586
Retail net revenue growth 4.1% 1.8% 9.2%
Comparable store sales growth 2.3% 3.5% 9.8%
Number of stores – beginning of year 576 592 610
Number of new stores 21 5 4
Number of acquired stores1—3—
Number of new stores due to remodeling2910 7
Number of permanently closed stores (16) (27) (24)
Number of closed stores due to remodeling2(9) (7) (5)
Number of stores – end of year 581 576 592
Store selling square footage at year-end 3,548,000 3,535,000 3,609,000
Store leased square footage (“LSF”) at year-end 5,778,000 5,743,000 5,831,000
1On November 1, 2011, we acquired Rejuvenation, Inc. See Note N to our Consolidated Financial Statements.
2Remodeled stores are defined as those stores temporarily closed and subsequently reopened during the year due to square
footage expansion, store modification or relocation.
28