PG&E 2008 Annual Report Download - page 93
Download and view the complete annual report
Please find page 93 of the 2008 PG&E annual report below. You can navigate through the pages in the report by either clicking on the pages listed below, or by using the keyword search tool below to find specific information within the annual report.-
 1
1 -
2
-
3
-
4
-
5
-
6
-
7
-
8
-
9
-
10
-
11
-
12
-
13
-
14
-
15
-
16
-
17
-
18
-
19
-
20
-
21
-
22
-
23
-
24
-
25
-
26
-
27
-
28
-
29
-
30
-
31
-
32
-
33
-
34
-
35
-
36
-
37
-
38
-
39
-
40
-
41
-
42
-
43
-
44
-
45
-
46
-
47
-
48
-
49
-
50
-
51
-
52
-
53
-
54
-
55
-
56
-
57
-
58
-
59
-
60
-
61
-
62
-
63
-
64
-
65
-
66
-
67
-
68
-
69
-
70
-
71
-
72
-
73
-
74
-
75
-
76
-
77
-
78
-
79
-
80
-
81
-
82
-
 83
83 -
 84
84 -
 85
85 -
 86
86 -
 87
87 -
 88
88 -
 89
89 -
 90
90 -
 91
91 -
 92
92 -
 93
93 -
 94
94 -
 95
95 -
 96
96 -
 97
97 -
 98
98 -
 99
99 -
 100
100 -
 101
101 -
 102
102 -
 103
103 -
104
-
105
-
106
-
107
-
108
-
109
-
110
-
111
-
112
-
113
-
114
-
115
-
116
-
117
-
118
-
119
-
120
-
121
-
122
-
123
-
124
-
125
-
126
-
127
-
128
-
129
-
130
-
131
-
132
-
133
-
134
-
135
-
136
-
137
-
138
-
139
-
140
-
141
-
142
-
143
-
144
-
145
-
146
-
147
-
148
-
149
-
150
-
151
-
152
-
153
-
154
-
155
-
156
 |
 |

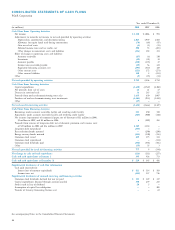
91
Year ended December 31,
(in millions) 2008 2007 2006
Cash Flows From Operating Activities
Net income $ 1,199 $ 1,024 $
985
Adjustments to reconcile net income to net cash provided by operating activities:
Depreciation, amortization, and decommissioning 1,838 1,956 1,802
Allowance for equity funds used during construction (70) (64) (47)
Gain on sale of assets (1) (1) (11)
Deferred income taxes and tax credits, net 593 43 (287)
Other changes in noncurrent assets and liabilities (25) 188 116
Effect of changes in operating assets and liabilities:
Accounts
receivable (83) (6) 128
Inventories (59) (41) 34
Accounts
payable (137) (196) 21
Income
taxes
receivable/payable 43 56 28
Regulatory balancing accounts, net (394) (567) 329
Other
current
assets (223) 170 (273)
Other
current
liabilities 90 24 (235)
Other
(5) (45) (13)
Net cash provided by operating activities 2,766 2,541 2,577
Cash Flows From Investing Activities
Capital expenditures (3,628) (2,768) (2,402)
Net proceeds from sale of assets 26 21 17
Decrease in restricted cash 36 185 115
Proceeds from nuclear decommissioning trust sales 1,635 830 1,087
Purchases of nuclear decommissioning trust investments (1,684) (933) (1,244)
Other
(25) — 1
Net cash used in investing activities (3,640) (2,665) (2,426)
Cash Flows From Financing Activities
Borrowings under accounts receivable facility and revolving credit facility 533 850 350
Repayments under accounts receivable facility and revolving credit facility (783) (900) (310)
Net issuance (repayments) of commercial paper, net of discount of $11 million in 2008,
$1 million in 2007, and $2 million in 2006 6 (209) 458
Proceeds from issuance of long-term debt, net of discount, premium, and issuance costs
of $19 million in 2008 and $16 million in 2007 2,185 1,184 —
Long-term debt repurchased (454) — —
Rate reduction bonds matured — (290) (290)
Energy recovery bonds matured (354) (340) (316)
Preferred stock dividends paid (14) (14) (14)
Common stock dividends paid (568) (509) (460)
Equity
contribution 270 400 —
Other
(36) 23 38
Net cash provided by (used in) fi nancing activities 785 195 (544)
Net change in cash and cash equivalents (89) 71 (393)
Cash and cash equivalents at January 1 141 70 463
Cash and cash equivalents at December 31 $ 52 $ 141 $ 70
Supplemental disclosures of cash fl ow information
Cash paid (received) for:
Interest (net of amounts capitalized) $
496 $ 474 $
476
Income taxes, net (95) 594 897
Supplemental disclosures of noncash investing and fi nancing activities
Capital expenditures fi nanced through accounts payable $
348 $ 279 $ 215
Assumption of capital lease obligation — — 408
Transfer of Gateway Generating Station asset — — 69
CONSOLIDATED STATEMENTS OF CASH FLOWS
Pacifi c Gas and Electric Company
See accompanying Notes to the Consolidated Financial Statements.