PG&E 2008 Annual Report Download - page 115
Download and view the complete annual report
Please find page 115 of the 2008 PG&E annual report below. You can navigate through the pages in the report by either clicking on the pages listed below, or by using the keyword search tool below to find specific information within the annual report.-
 1
1 -
2
-
3
-
4
-
5
-
6
-
7
-
8
-
9
-
10
-
11
-
12
-
13
-
14
-
15
-
16
-
17
-
18
-
19
-
20
-
21
-
22
-
23
-
24
-
25
-
26
-
27
-
28
-
29
-
30
-
31
-
32
-
33
-
34
-
35
-
36
-
37
-
38
-
39
-
40
-
41
-
42
-
43
-
44
-
45
-
46
-
47
-
48
-
49
-
50
-
51
-
52
-
53
-
54
-
55
-
56
-
57
-
58
-
59
-
60
-
61
-
62
-
63
-
64
-
65
-
66
-
67
-
68
-
69
-
70
-
71
-
72
-
73
-
74
-
75
-
76
-
77
-
78
-
79
-
80
-
81
-
82
-
83
-
84
-
85
-
86
-
87
-
88
-
89
-
90
-
91
-
92
-
93
-
94
-
95
-
96
-
97
-
98
-
99
-
100
-
101
-
102
-
103
-
104
-
 105
105 -
 106
106 -
 107
107 -
 108
108 -
 109
109 -
 110
110 -
 111
111 -
 112
112 -
 113
113 -
 114
114 -
 115
115 -
 116
116 -
 117
117 -
 118
118 -
 119
119 -
 120
120 -
 121
121 -
 122
122 -
 123
123 -
 124
124 -
 125
125 -
126
-
127
-
128
-
129
-
130
-
131
-
132
-
133
-
134
-
135
-
136
-
137
-
138
-
139
-
140
-
141
-
142
-
143
-
144
-
145
-
146
-
147
-
148
-
149
-
150
-
151
-
152
-
153
-
154
-
155
-
156
 |
 |

113
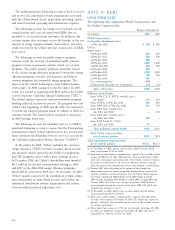
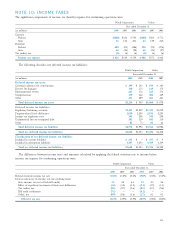
NOTE 10: INCOME TAXES
The signifi cant components of income tax (benefi t) expense for continuing operations were:
PG&E Corporation Utility
Year ended December 31,
(in millions) 2008 2007 2006 2008 2007 2006
Current:
Federal $(268) $526 $ 743 $(188) $563 $ 771
State 33 140 201 24 149 210
Deferred:
Federal 604 (81) (286) 596 (92) (276)
State
62 (40) (98) 62 (43) (97)
Tax credits, net (6) (6) (6) (6) (6) (6)
Income tax expense $ 425 $539 $ 554 $ 488 $571 $ 602
The following describes net deferred income tax liabilities:
PG&E Corporation Utility
Year ended December 31,
(in millions) 2008 2007 2008 2007
Deferred income tax assets:
Customer advances for construction $ 199 $ 143 $ 199 $ 143
Reserve for damages 130 173 129 173
Environmental reserve 225 172 225 172
Compensation 339 162 306 129
Other 231 289 201 261
Total deferred income tax assets $1,124 $ 939 $1,060 $ 878
Deferred income tax liabilities:
Regulatory balancing accounts $1,425 $1,219 $1,425 $1,219
Property-related basis differences 2,819 2,290 2,813 2,293
Income tax regulatory asset 345 298 345 298
Unamortized loss on reacquired debt 102 110 102 110
Other 81 75 81 66
Total deferred income tax liabilities $4,772 $3,992 $4,766 $3,986
Total net deferred income tax liabilities $3,648 $3,053 $3,706 $3,108
Classifi cation of net deferred income tax liabilities:
Included in current liabilities $
251 $ — $ 257 $ 4
Included in noncurrent liabilities 3,397 3,053 3,449 3,104
Total net deferred income tax liabilities $3,648 $3,053 $3,706 $3,108
The differences between income taxes and amounts calculated by applying the federal statutory rate to income before
income tax expense for continuing operations were:
PG&E Corporation Utility
Year ended December 31,
2008 2007 2006 2008 2007 2006
Federal statutory income tax rate 35.0% 35.0% 35.0% 35.0% 35.0% 35.0%
Increase (decrease) in income tax rate resulting from:
State income tax (net of federal benefi t) 3.1 4.2 4.3 3.3 4.3 4.6
Effect of regulatory treatment of fi xed asset differences (3.2) (3.0) (1.2) (3.1) (2.9) (1.1)
Tax credits, net (0.5) (0.7) (0.6) (0.5) (0.7) (0.6)
IRS audit settlements (7.1) — —
(4.1) — —
Other, net (0.9) (0.6) (1.6) (1.7) 0.1 0.1
Effective tax rate 26.4% 34.9% 35.9% 28.9% 35.8% 38.0%