PG&E 2008 Annual Report Download - page 120
Download and view the complete annual report
Please find page 120 of the 2008 PG&E annual report below. You can navigate through the pages in the report by either clicking on the pages listed below, or by using the keyword search tool below to find specific information within the annual report.-
 1
1 -
2
-
3
-
4
-
5
-
6
-
7
-
8
-
9
-
10
-
11
-
12
-
13
-
14
-
15
-
16
-
17
-
18
-
19
-
20
-
21
-
22
-
23
-
24
-
25
-
26
-
27
-
28
-
29
-
30
-
31
-
32
-
33
-
34
-
35
-
36
-
37
-
38
-
39
-
40
-
41
-
42
-
43
-
44
-
45
-
46
-
47
-
48
-
49
-
50
-
51
-
52
-
53
-
54
-
55
-
56
-
57
-
58
-
59
-
60
-
61
-
62
-
63
-
64
-
65
-
66
-
67
-
68
-
69
-
70
-
71
-
72
-
73
-
74
-
75
-
76
-
77
-
78
-
79
-
80
-
81
-
82
-
83
-
84
-
85
-
86
-
87
-
88
-
89
-
90
-
91
-
92
-
93
-
94
-
95
-
96
-
97
-
98
-
99
-
100
-
101
-
102
-
103
-
104
-
105
-
106
-
107
-
108
-
109
-
 110
110 -
 111
111 -
 112
112 -
 113
113 -
 114
114 -
 115
115 -
 116
116 -
 117
117 -
 118
118 -
 119
119 -
 120
120 -
 121
121 -
 122
122 -
 123
123 -
 124
124 -
 125
125 -
 126
126 -
 127
127 -
 128
128 -
 129
129 -
 130
130 -
131
-
132
-
133
-
134
-
135
-
136
-
137
-
138
-
139
-
140
-
141
-
142
-
143
-
144
-
145
-
146
-
147
-
148
-
149
-
150
-
151
-
152
-
153
-
154
-
155
-
156
 |
 |

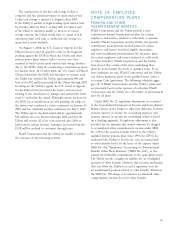
118
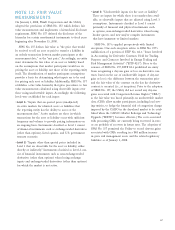
available, such as credit default swap spreads. When such
information is not available, internal models may be used.
As of December 31, 2008, the nonperformance and credit
risk adjustment represents approximately 5% of the net price
risk management value. As permitted under SFAS No. 157,
PG&E Corporation and the Utility utilize a mid-market
pricing convention (the mid-point between bid and ask
prices) as a practical expedient in valuing the majority
of its derivative assets and liabilities at fair value.
PG&E Corporation’s and the Utility’s fair value
measurements incorporate various factors required under
SFAS No. 157 such as the credit standing of the counter-
parties involved, nonperformance risk including the risk of
non performance by PG&E Corporation and the Utility on
their liabilities, the applicable exit market, and specifi c risks
inherent in the instrument. Nonperformance and credit
risk adjustments on the Utility’s price risk management
instruments are based on current market inputs when
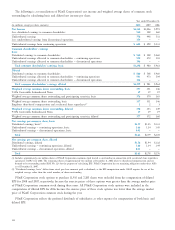
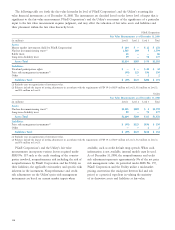
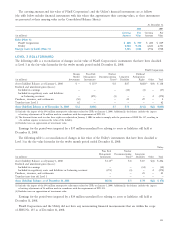
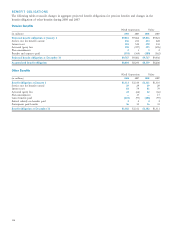
The following table sets forth the fair value hierarchy by level of PG&E Corporation’s and the Utility’s recurring fair
value fi nancial instruments as of December 31, 2008. The instruments are classifi ed based on the lowest level of input that is
signifi cant to the fair value measurement. PG&E Corporation’s and the Utility’s assessment of the signifi cance of a particular
input to the fair value measurement requires judgment, and may affect the valuation of fair value assets and liabilities and
their placement within the fair value hierarchy levels.
PG&E Corporation
Fair Value Measurements as of December 31, 2008
(in millions) Level 1 Level 2 Level 3 Total
Assets:
Money market investments (held by PG&E Corporation) $ 164 $ — $ 12 $ 176
Nuclear decommissioning trusts(1) 1,505 289 5 1,799
Rabbi trusts 66 — — 66
Long-term disability trust 99 — 78 177
Assets Total $1,834 $289 $ 95 $2,218
Liabilities:
Dividend participation rights $
— $ — $ 42 $ 42
Price risk management instruments(2) (49) 123 156 230
Other — — 2 2
Liabilities Total $
(49) $123 $200 $ 274
(1) Excludes taxes on appreciation of investment value.
(2) Balances include the impact of netting adjustments in accordance with the requirements of FIN 39-1 of $159 million to Level 1, $32 million to Level 2,
and $76 million to Level 3.
Utility
Fair Value Measurements as of December 31, 2008
(in millions) Level 1 Level 2 Level 3 Total
Assets:
Nuclear decommissioning trusts(1) $1,505 $289 $ 5 $1,799
Long-term disability trust 99 — 78 177
Assets Total $1,604 $289 $ 83 $1,976
Liabilities:
Price risk management instruments(2) $ (49) $123 $156 $ 230
Other — — 2 2
Liabilities Total $
(49) $123 $158 $ 232
(1) Excludes taxes on appreciation of investment value.
(2) Balances include the impact of netting adjustments in accordance with the requirements of FIN 39-1 of $159 million to Level 1, $32 million to Level 2,
and $76 million to Level 3.