PG&E 2008 Annual Report Download - page 146
Download and view the complete annual report
Please find page 146 of the 2008 PG&E annual report below. You can navigate through the pages in the report by either clicking on the pages listed below, or by using the keyword search tool below to find specific information within the annual report.
144
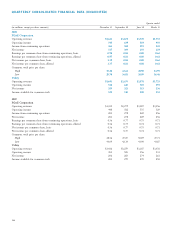
Quarter ended
(in millions, except per share amounts) December 31 September 30 June 30 March 31
2008
PG&E Corporation
Operating revenues $3,643 $3,674 $3,578 $3,733
Operating income 545 639 584 493
Income from continuing operations 363 304 293 224
Net income 517 304 293 224
Earnings per common share from continuing operations, basic 0.98 0.83 0.80 0.62
Earnings per common share from continuing operations, diluted 0.97 0.83 0.80 0.62
Net income per common share, basic 1.39 0.83 0.80 0.62
Net income per common share, diluted 1.37 0.83 0.80 0.62
Common stock price per share:
High
39.20 42.64 40.90 44.95
Low 29.70 36.81 38.09 36.46
Utility
Operating revenues $3,643 $3,674 $3,578 $3,733
Operating income 548 640 585 493
Net income 329 321 313 236
Income available for common stock 325 318 309 233
2007
PG&E Corporation
Operating
revenues $3,415 $3,279 $3,187 $3,356
Operating income 448 582 555 529
Income from continuing operations 203 278 269 256
Net income 203 278 269 256
Earnings per common share from continuing operations, basic 0.56 0.77 0.75 0.71
Earnings per common share from continuing operations, diluted 0.56 0.77 0.74 0.71
Net income per common share, basic 0.56 0.77 0.75 0.71
Net income per common share, diluted 0.56 0.77 0.74 0.71
Common stock price per share:
High 48.56 47.87 50.89 47.71
Low 43.09 42.14 43.90 43.87
Utility
Operating revenues $3,416 $3,279 $3,187 $3,356
Operating income 453 585 556 531
Net income 206 283 274 261
Income available for common stock 203 279 270 258
QUARTERLY CONSOLIDATED FINANCIAL DATA (UNAUDITED)


