PG&E 2008 Annual Report Download - page 45
Download and view the complete annual report
Please find page 45 of the 2008 PG&E annual report below. You can navigate through the pages in the report by either clicking on the pages listed below, or by using the keyword search tool below to find specific information within the annual report.-
 1
1 -
2
-
3
-
4
-
5
-
6
-
7
-
8
-
9
-
10
-
11
-
12
-
13
-
14
-
15
-
16
-
17
-
18
-
19
-
20
-
21
-
22
-
23
-
24
-
25
-
26
-
27
-
28
-
29
-
30
-
31
-
32
-
33
-
34
-
 35
35 -
 36
36 -
 37
37 -
 38
38 -
 39
39 -
 40
40 -
 41
41 -
 42
42 -
 43
43 -
 44
44 -
 45
45 -
 46
46 -
 47
47 -
 48
48 -
 49
49 -
 50
50 -
 51
51 -
 52
52 -
 53
53 -
 54
54 -
 55
55 -
56
-
57
-
58
-
59
-
60
-
61
-
62
-
63
-
64
-
65
-
66
-
67
-
68
-
69
-
70
-
71
-
72
-
73
-
74
-
75
-
76
-
77
-
78
-
79
-
80
-
81
-
82
-
83
-
84
-
85
-
86
-
87
-
88
-
89
-
90
-
91
-
92
-
93
-
94
-
95
-
96
-
97
-
98
-
99
-
100
-
101
-
102
-
103
-
104
-
105
-
106
-
107
-
108
-
109
-
110
-
111
-
112
-
113
-
114
-
115
-
116
-
117
-
118
-
119
-
120
-
121
-
122
-
123
-
124
-
125
-
126
-
127
-
128
-
129
-
130
-
131
-
132
-
133
-
134
-
135
-
136
-
137
-
138
-
139
-
140
-
141
-
142
-
143
-
144
-
145
-
146
-
147
-
148
-
149
-
150
-
151
-
152
-
153
-
154
-
155
-
156
 |
 |

43
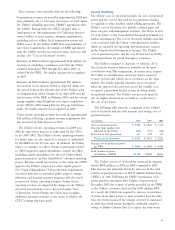
Cost of Natural Gas
The Utility’s cost of natural gas includes the purchase costs
of natural gas and transportation costs on interstate pipelines
and intrastate pipelines, but excludes the transportation costs
for non-core customers, which are included in Operating
and maintenance expense in the Consolidated Statements
of Income. The Utility’s cost of gas also includes realized
gains and losses on price risk management activities. (See
Notes 11 and 12 of the Notes to the Consolidated Financial
Statements for further information.) The Utility’s cost of
gas is passed through to customers.
The following table provides a summary of the Utility’s
cost of natural gas:
(in millions) 2008 2007 2006
Cost of natural gas sold $1,955 $1,859 $1,958
Cost of natural gas transportation 135 176 139
Total cost of natural gas $2,090 $2,035 $2,097
Average cost per Mcf of
natural gas sold $ 7.43 $ 7.04 $ 7.28
Total natural gas sold
(in millions of Mcf) 263 264 269
The Utility’s total cost of natural gas increased by approx-
imately $55 million, or 3%, in 2008 compared to 2007, pri-
marily due to increases in the average market price of natural
gas purchased. The increase was partially offset by an approx-
imately $23 million refund the Utility received as part of a
settlement with TransCanada’s Gas Transmission Northwest
Corporation for 2007 gas transmission capacity rates.
The Utility’s total cost of natural gas decreased by
approximately $62 million, or 3%, in 2007 compared to
2006, primarily due to a decrease in the average market price
of natural gas purchased of approximately $0.24 per Mcf,
or 3%. Average market prices were signifi cantly higher in the
beginning of 2006 as damages to production facilities caused
by severe weather reduced natural gas supply. In addition,
the price of natural gas declined due to a relatively mild
hurricane season in 2007 as compared to industry forecasts,
resulting in no material supply disruptions, and a relatively
large amount of natural gas in storage across the nation.
The Utility’s future cost of natural gas will be impacted
by the market price of natural gas and changes in customer
demand. In addition, the Utility’s future cost of gas also
may be affected by federal or state legislation or rules to
regulate the emissions of greenhouse gases from the Utility’s
natural gas transportation and distribution facilities, and
from natural gas consumed by the Utility’s customers.
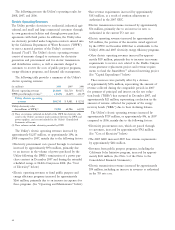
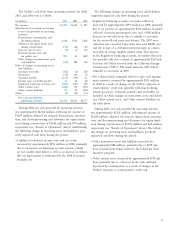
The following table provides a summary of the Utility’s
natural gas operating revenues:
(in millions) 2008 2007 2006
Bundled natural gas revenues $3,557 $3,417 $3,472
Transportation service-only revenues 333 340 315
Total natural gas operating
revenues $3,890 $3,757 $3,787
Average bundled revenue per Mcf(1)
of natural gas sold $13.52 $12.94 $12.91
Total bundled natural gas sales
(in millions of Mcf) 263 264 269
(1) One thousand cubic feet
The Utility’s natural gas operating revenues increased
by approximately $133 million, or 4%, in 2008 compared
to 2007. The increase in natural gas operating revenues
primarily refl ects an overall increase in the cost of natural
gas of approximately $55 million (see “Cost of Natural
Gas” below), an increase in base revenue requirements as a
result of attrition adjustments authorized in the 2007 GRC
of approximately $22 million, an increase in natural gas
revenue requirements to fund the SmartMeter™ advanced
metering project of approximately $25 million, and an
increase of $24 million in natural gas revenues to fund
energy effi ciency public purpose programs. The increase
in natural gas operating revenues also includes $7 million,
the portion of the incentive award approved by the CPUC
in December 2008 that is attributable to the Utility’s 2006
and 2007 natural gas energy effi ciency programs.
The Utility’s natural gas operating revenues decreased
by approximately $30 million, or less than one percent,
in 2007 compared to 2006. This was primarily due to a
decrease in the cost of natural gas, which is passed through
to customers. This decrease was partially offset by the
increased base revenue requirements authorized in the 2007
GRC and an increase in revenue requirements relating to
the SmartMeter™ project.
Future natural gas operating revenues will be impacted
by changes in the cost of natural gas, the Utility’s gas trans-
portation rates, natural gas throughput volume, and other
factors. For 2008 through 2010, the Gas Accord IV settle-
ment agreement provides for an overall modest increase
in the revenue requirements and rates for the Utility’s gas
transmission and storage services. In addition, the Utility’s
natural gas operating revenues for distribution are expected
to increase through 2010 as a result of revenue requirement
increases authorized by the CPUC in the 2007 GRC. Finally,
the Utility may recognize incentive revenues to the extent it
achieves the CPUC’s energy effi ciency goals.