PG&E 2008 Annual Report Download - page 129
Download and view the complete annual report
Please find page 129 of the 2008 PG&E annual report below. You can navigate through the pages in the report by either clicking on the pages listed below, or by using the keyword search tool below to find specific information within the annual report.-
 1
1 -
2
-
3
-
4
-
5
-
6
-
7
-
8
-
9
-
10
-
11
-
12
-
13
-
14
-
15
-
16
-
17
-
18
-
19
-
20
-
21
-
22
-
23
-
24
-
25
-
26
-
27
-
28
-
29
-
30
-
31
-
32
-
33
-
34
-
35
-
36
-
37
-
38
-
39
-
40
-
41
-
42
-
43
-
44
-
45
-
46
-
47
-
48
-
49
-
50
-
51
-
52
-
53
-
54
-
55
-
56
-
57
-
58
-
59
-
60
-
61
-
62
-
63
-
64
-
65
-
66
-
67
-
68
-
69
-
70
-
71
-
72
-
73
-
74
-
75
-
76
-
77
-
78
-
79
-
80
-
81
-
82
-
83
-
84
-
85
-
86
-
87
-
88
-
89
-
90
-
91
-
92
-
93
-
94
-
95
-
96
-
97
-
98
-
99
-
100
-
101
-
102
-
103
-
104
-
105
-
106
-
107
-
108
-
109
-
110
-
111
-
112
-
113
-
114
-
115
-
116
-
117
-
118
-
 119
119 -
 120
120 -
 121
121 -
 122
122 -
 123
123 -
 124
124 -
 125
125 -
 126
126 -
 127
127 -
 128
128 -
 129
129 -
 130
130 -
 131
131 -
 132
132 -
 133
133 -
 134
134 -
 135
135 -
 136
136 -
 137
137 -
 138
138 -
 139
139 -
140
-
141
-
142
-
143
-
144
-
145
-
146
-
147
-
148
-
149
-
150
-
151
-
152
-
153
-
154
-
155
-
156
 |
 |

127
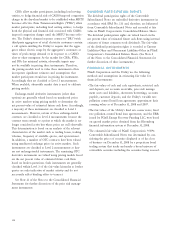
CHANGE IN PLAN ASSETS
To determine the fair value of the plan assets, PG&E Corporation and the Utility use publicly quoted market values and
independent pricing services depending on the nature of the assets, as reported by the trustee.
The following tables reconcile aggregate changes in plan assets during 2008 and 2007:
Pension Benefi ts
PG&E Corporation Utility
(in millions) 2008 2007 2008 2007
Fair value of plan assets at January 1 $ 9,540 $9,028 $ 9,540 $9,028
Actual return on plan assets (1,232) 766 (1,232) 766
Company contributions 182 139 179 137
Benefi ts and expenses paid (424) (393) (421) (391)
Fair value of plan assets at December 31 $ 8,066 $9,540 $ 8,066 $9,540
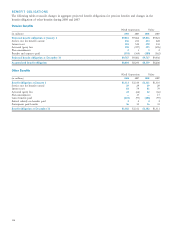
Other Benefi ts
PG&E Corporation Utility
(in millions) 2008 2007 2008 2007
Fair value of plan assets at January 1 $1,331 $1,256 $1,331 $1,256
Actual return on plan assets (316) 107 (316) 107
Company contributions 48 38 48 38
Plan participant contribution 36 36 36 36
Benefi ts and expenses paid (109) (106) (109) (106)
Fair value of plan assets at December 31 $ 990 $1,331 $ 990 $1,331
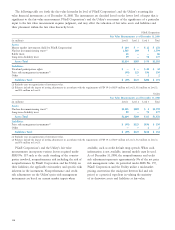
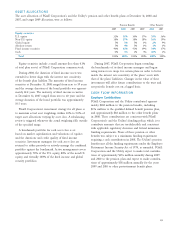
FUNDED STATUS
The following schedule shows the plans’ aggregate funded status on a plan sponsor basis. The funded status is the difference
between the fair value of plan assets and projected benefi t obligations.
Pension Benefi ts
PG&E Corporation Utility
December 31, December 31,
(in millions) 2008 2007 2008 2007
Fair value of plan assets at December 31 $ 8,066 $ 9,540 $ 8,066 $ 9,540
Projected benefi t obligation at December 31 (9,767) (9,081) (9,717) (9,036)
Prepaid/(accrued) benefi t cost $(1,701) $ 459 $(1,651) $ 504
Noncurrent asset $ — $ 532 $
— $ 532
Current liability (5) (2) (3) (3)
Noncurrent liability (1,696) (71) (1,648) (25)
Prepaid/(accrued) benefi t cost $(1,701) $ 459 $(1,651) $ 504
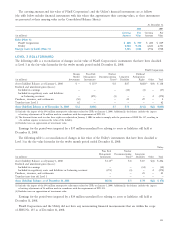
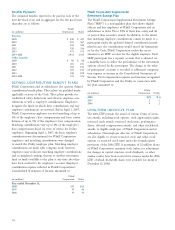
Other Benefi ts
PG&E Corporation Utility
December 31, December 31,
(in millions) 2008 2007 2008 2007
Fair value of plan assets at December 31 $ 990 $ 1,331 $ 990 $ 1,331
Benefi t obligation at December 31 (1,382) (1,311) (1,382) (1,311)
Prepaid/(accrued) benefi t cost $
(392) $ 20 $ (392) $ 20
Noncurrent asset $ — $ 54 $
— $ 5 4
Noncurrent liability (392) (34) (392) (34)
Prepaid/(accrued) benefi t cost $
(392) $ 20 $ (392) $ 20