PG&E 2008 Annual Report Download - page 55
Download and view the complete annual report
Please find page 55 of the 2008 PG&E annual report below. You can navigate through the pages in the report by either clicking on the pages listed below, or by using the keyword search tool below to find specific information within the annual report.-
 1
1 -
2
-
3
-
4
-
5
-
6
-
7
-
8
-
9
-
10
-
11
-
12
-
13
-
14
-
15
-
16
-
17
-
18
-
19
-
20
-
21
-
22
-
23
-
24
-
25
-
26
-
27
-
28
-
29
-
30
-
31
-
32
-
33
-
34
-
35
-
36
-
37
-
38
-
39
-
40
-
41
-
42
-
43
-
44
-
 45
45 -
 46
46 -
 47
47 -
 48
48 -
 49
49 -
 50
50 -
 51
51 -
 52
52 -
 53
53 -
 54
54 -
 55
55 -
 56
56 -
 57
57 -
 58
58 -
 59
59 -
 60
60 -
 61
61 -
 62
62 -
 63
63 -
 64
64 -
 65
65 -
66
-
67
-
68
-
69
-
70
-
71
-
72
-
73
-
74
-
75
-
76
-
77
-
78
-
79
-
80
-
81
-
82
-
83
-
84
-
85
-
86
-
87
-
88
-
89
-
90
-
91
-
92
-
93
-
94
-
95
-
96
-
97
-
98
-
99
-
100
-
101
-
102
-
103
-
104
-
105
-
106
-
107
-
108
-
109
-
110
-
111
-
112
-
113
-
114
-
115
-
116
-
117
-
118
-
119
-
120
-
121
-
122
-
123
-
124
-
125
-
126
-
127
-
128
-
129
-
130
-
131
-
132
-
133
-
134
-
135
-
136
-
137
-
138
-
139
-
140
-
141
-
142
-
143
-
144
-
145
-
146
-
147
-
148
-
149
-
150
-
151
-
152
-
153
-
154
-
155
-
156
 |
 |

53
Future cash fl ows used in investing activities are largely
dependent on expected capital expenditures. (See “Capital
Expenditures” below for further discussion of expected
spending and signifi cant capital projects.)
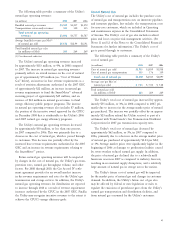
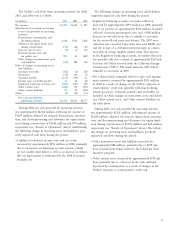
Financing Activities
The Utility’s cash fl ows from fi
nancing activities for 2008,
2007, and 2006 were as follows:
(in millions) 2008 2007 2006
Borrowings under accounts receivable
facility and revolving credit facility $ 533 $ 850 $ 350
Repayments under accounts receivable
facility and revolving credit facility (783) (900) (310)
Net issuance (repayments) of
commercial paper, net of discount
of $11 million in 2008, $1 million
in 2007, and $2 million in 2006 6 (209) 458
Proceeds from issuance of long-term
debt, net of discount, premium,
and issuance costs of $19 million
in 2008 and $16 million in 2007 2,185 1,184 —
Long-term debt repurchased (454) — —
Rate reduction bonds matured — (290) (290)
Energy recovery bonds matured (354) (340) (316)
Preferred stock dividends paid (14) (14) (14)
Common stock dividends paid (568) (509)
(460)
Equity contribution 270 400 —
Other (36) 23 38
Net cash provided by (used in)
fi nancing activities $
785 $ 195 $(544)
In 2008, net cash provided by fi nancing activities
increased by approximately $590 million compared to 2007.
In 2007, net cash provided by fi nancing activities increased
by approximately $739 million compared to 2006. Cash
provided by or used in fi nancing activities is driven by the
Utility’s fi nancing needs, which depends on the level of cash
provided by or used in operating activities and the level of
cash provided by or used in investing activities. The Utility
generally utilizes long-term senior unsecured debt issuances
and equity contributions from PG&E Corporation to fund
debt maturities and capital expenditures, and relies on short-
term debt to fund temporary fi nancing needs.
PG&E CORPORATION
With the exception of dividend payments, interest, and trans-
actions between PG&E Corporation and the Utility, PG&E
Corporation had no material cash fl ows on a stand-alone
basis for the years ended December 31, 2008, 2007, and 2006.
In addition, the ongoing upheaval in the economy has
negatively impacted investment returns on assets held in
trust to satisfy the Utility’s obligations to decommission
its nuclear generation facilities and to secure payment of
employee benefi ts under pension and other postretirement
benefi t plans. The Utility’s recorded liabilities and, in some
cases, its funding obligations, may increase as a result of
declining investment returns on trust assets and lower
assumed rates of return. However, the Utility believes that it
is probable that any increase in funding obligations would
be recoverable through rates, and as a result is not expected
to have a material impact on the Utility’s cash fl ows or
results of operations.
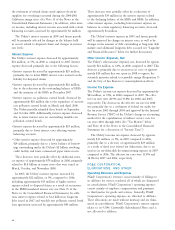
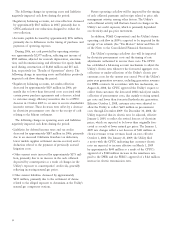
Investing Activities
The Utility’s investing activities consist of construction of
new and replacement facilities necessary to deliver safe and
reliable electricity and natural gas services to its customers.
Cash used in investing activities depends primarily upon
the amount and type of construction activities, which can
be infl uenced by the need to make electricity and natural
gas reliability improvements, storms, and other factors.
The Utility’s cash fl ows from investing activities for 2008,
2007, and 2006 were as follows:
(in millions) 2008 2007 2006
Capital expenditures $(3,628) $(2,768) $(2,402)
Net proceeds from sale of assets 26 21 17
Decrease in restricted cash 36 185 115
Proceeds from nuclear
decommissioning trust sales 1,635 830 1,087
Purchases of nuclear
decommissioning
trust
investments (1,684) (933) (1,244)
Other (25) — 1
Net cash used in
investing
activities $(3,640) $(2,665) $(2,426)
Net cash used in investing activities increased by
approximately $975 million in 2008 compared to 2007
and by approximately $239 million in 2007 compared to
2006. These increases were primarily due to increases of
approximately $860 million and $366 million in 2008 and
2007, respectively, of capital expenditures for installing the
SmartMeter™ advanced metering infrastructure, generation
facility spending, replacing and expanding gas and electric
distribution systems, and improving the electric transmission
infrastructure. (See “Capital Expenditures” below.)