PG&E 2008 Annual Report Download - page 133
Download and view the complete annual report
Please find page 133 of the 2008 PG&E annual report below. You can navigate through the pages in the report by either clicking on the pages listed below, or by using the keyword search tool below to find specific information within the annual report.-
 1
1 -
2
-
3
-
4
-
5
-
6
-
7
-
8
-
9
-
10
-
11
-
12
-
13
-
14
-
15
-
16
-
17
-
18
-
19
-
20
-
21
-
22
-
23
-
24
-
25
-
26
-
27
-
28
-
29
-
30
-
31
-
32
-
33
-
34
-
35
-
36
-
37
-
38
-
39
-
40
-
41
-
42
-
43
-
44
-
45
-
46
-
47
-
48
-
49
-
50
-
51
-
52
-
53
-
54
-
55
-
56
-
57
-
58
-
59
-
60
-
61
-
62
-
63
-
64
-
65
-
66
-
67
-
68
-
69
-
70
-
71
-
72
-
73
-
74
-
75
-
76
-
77
-
78
-
79
-
80
-
81
-
82
-
83
-
84
-
85
-
86
-
87
-
88
-
89
-
90
-
91
-
92
-
93
-
94
-
95
-
96
-
97
-
98
-
99
-
100
-
101
-
102
-
103
-
104
-
105
-
106
-
107
-
108
-
109
-
110
-
111
-
112
-
113
-
114
-
115
-
116
-
117
-
118
-
119
-
120
-
121
-
122
-
 123
123 -
 124
124 -
 125
125 -
 126
126 -
 127
127 -
 128
128 -
 129
129 -
 130
130 -
 131
131 -
 132
132 -
 133
133 -
 134
134 -
 135
135 -
 136
136 -
 137
137 -
 138
138 -
 139
139 -
 140
140 -
 141
141 -
 142
142 -
 143
143 -
144
-
145
-
146
-
147
-
148
-
149
-
150
-
151
-
152
-
153
-
154
-
155
-
156
 |
 |

131
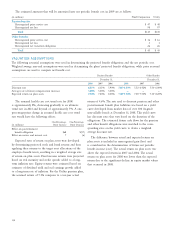
During 2007, PG&E Corporation began extending
the benchmarks of its fi xed income managers and began
using interest rate swaps for certain plans in order to better
match the interest rate sensitivity of the plans’ assets with
that of the plans’ liabilities. Changes in the value of these
investments will affect future contributions to the trust and
net periodic benefi t cost on a lagged basis.
CASH FLOW INFORMATION
Employer Contributions
PG&E Corporation and the Utility contributed approxi-
mately $182 million to the pension benefi ts, including
$176 million to the qualifi ed defi ned benefi t pension plan,
and approximately $48 million to the other benefi t plans
in 2008. These contributions are consistent with PG&E
Corporation’s and the Utility’s funding policy, which is to
contribute amounts that are tax-deductible and consistent
with applicable regulatory decisions and federal minimum
funding requirements. None of these pension or other
benefi ts was subject to a minimum funding requirement
requiring a cash contribution in 2008. The Utility’s pension
benefi ts met all the funding requirements under the Employee
Retirement Income Security Act of 1974, as amended. PG&E
Corporation and the Utility expect to make total contribu-
tions of approximately $176 million annually during 2009
and 2010 to the pension plan and expect to make contribu-
tions of approximately $58 million annually for the years
2009 and 2010 to other postretirement benefi t plans.
Equity securities include a small amount (less than 0.1%
of total plan assets) of PG&E Corporation common stock.
During 2008, the duration of fi xed income assets was
extended to better align with the interest rate sensitivity
of the benefi t plan liability. The maturity of fi xed income
securities at December 31, 2008 ranged from zero to 59 years
and the average duration of the bond portfolio was approxi-
mately 12.2 years. The maturity of fi xed income securities
at December 31, 2007 ranged from zero to 60 years and the
average duration of the bond portfolio was approximately
10.5 years.
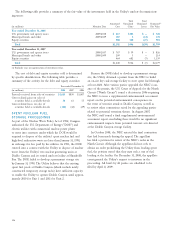
PG&E Corporation’s investment strategy for all plans is
to maintain actual asset weightings within 1.0% to 5.0% of
target asset allocations varying by asset class. A rebalancing
review is triggered whenever the actual weighting falls outside
of the specifi ed range.
A benchmark portfolio for each asset class is set
based on market capitalization and valuations of equities
and the durations and credit quality of fi xed income
securities. Investment managers for each asset class are
retained to either passively or actively manage the combined
portfolio against the benchmark. Active management covers
approximately 70% of the U.S. equity, 80% of the non-U.S.
equity, and virtually 100% of the fi xed income and global
security portfolios.
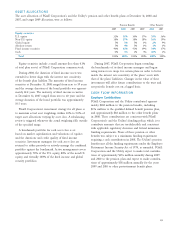
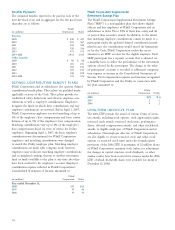
ASSET ALLOCATIONS
The asset allocation of PG&E Corporation’s and the Utility’s pension and other benefi t plans at December 31, 2008 and
2007, and target 2009 allocation, were as follows:
Pension Benefi ts Other Benefi ts
2009 2008 2007 2009 2008 2007
Equity securities
U.S. equity 32% 31% 30% 37% 35% 36%
Non-U.S. equity 18% 17% 18% 18% 16% 19%
Global equity 5% 3% 5% 3% 2% 4%
Absolute return 5% 4% 5% 3% 3% 3%
Fixed income securities 40% 42% 41% 34% 34% 37%
Cash 0% 3% 1% 5%
10% 1%
Total 100% 100% 100% 100% 100% 100%