PG&E 2008 Annual Report Download - page 53
Download and view the complete annual report
Please find page 53 of the 2008 PG&E annual report below. You can navigate through the pages in the report by either clicking on the pages listed below, or by using the keyword search tool below to find specific information within the annual report.-
 1
1 -
2
-
3
-
4
-
5
-
6
-
7
-
8
-
9
-
10
-
11
-
12
-
13
-
14
-
15
-
16
-
17
-
18
-
19
-
20
-
21
-
22
-
23
-
24
-
25
-
26
-
27
-
28
-
29
-
30
-
31
-
32
-
33
-
34
-
35
-
36
-
37
-
38
-
39
-
40
-
41
-
42
-
 43
43 -
 44
44 -
 45
45 -
 46
46 -
 47
47 -
 48
48 -
 49
49 -
 50
50 -
 51
51 -
 52
52 -
 53
53 -
 54
54 -
 55
55 -
 56
56 -
 57
57 -
 58
58 -
 59
59 -
 60
60 -
 61
61 -
 62
62 -
 63
63 -
64
-
65
-
66
-
67
-
68
-
69
-
70
-
71
-
72
-
73
-
74
-
75
-
76
-
77
-
78
-
79
-
80
-
81
-
82
-
83
-
84
-
85
-
86
-
87
-
88
-
89
-
90
-
91
-
92
-
93
-
94
-
95
-
96
-
97
-
98
-
99
-
100
-
101
-
102
-
103
-
104
-
105
-
106
-
107
-
108
-
109
-
110
-
111
-
112
-
113
-
114
-
115
-
116
-
117
-
118
-
119
-
120
-
121
-
122
-
123
-
124
-
125
-
126
-
127
-
128
-
129
-
130
-
131
-
132
-
133
-
134
-
135
-
136
-
137
-
138
-
139
-
140
-
141
-
142
-
143
-
144
-
145
-
146
-
147
-
148
-
149
-
150
-
151
-
152
-
153
-
154
-
155
-
156
 |
 |

51
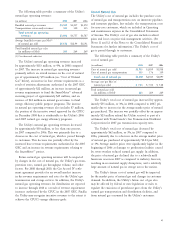
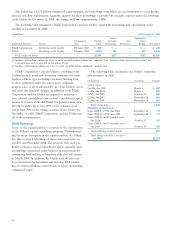
The following changes in operating assets and liabilities
negatively impacted cash fl ows during the period:
• Regulatory balancing accounts, net under-collection
increased by approximately $394 million in 2008, primarily
due to an increase of approximately $356 million in under-
collected electricity procurement costs and a $108 million
decrease in over-collections due to refunds to customers
for the over-collected prior year balance. The 2007 over-
collection was caused by lower than forecasted RMR costs
and the receipt of a settlement payment made in connec-
tion with an energy supplier refund claim. This increase
in the Regulatory balancing accounts, net under-collection
was partially offset by a refund of approximately $230 mil-
lion that the Utility received from the California Energy
Commission (“CEC”). The funds from the CEC will be
refunded to customers in 2009.
• Net collateral paid, primarily related to price risk manage-
ment activities, increased by approximately $325 million
in 2008 as a result of changes in the Utility’s exposure to
counterparties’ credit risk, generally refl ecting declining
natural gas prices. Collateral payables and receivables are
included in Other changes in noncurrent assets and liabili-
ties, Other current assets, and Other current liabilities in
the table above.
During 2007, net cash provided by operating activities
was approximately $2,541 million, refl ecting net income of
$1,024 million, adjusted for noncash depreciation, amortiza-
tion, and decommissioning and allowance for equity funds
used during construction of $1,956 million and $64 million,
respectively (see “Results of Operations” above). The follow-
ing changes in operating assets and liabilities positively
impacted cash fl ows during the period:
• Other noncurrent assets and liabilities increased by
approximately $188 million, primarily due to $159 mil-
lion of under-spent funds related to the California Solar
Incentive program.
• Other current assets decreased by approximately $170 mil-
lion, primarily due to a decrease in the cash collateral
deposited by counterparties as a result of changes in the
Utility’s exposure to counterparties’ credit risk.
The Utility’s cash fl ows from operating activities for 2008,
2007, and 2006 were as follows:
(in millions) 2008 2007 2006
Net income $1,199 $1,024 $ 985
Adjustments to reconcile net income
to net cash provided by operating
activities:
Depreciation, amortization, and
decommissioning 1,838 1,956 1,802
Allowance for equity funds used
during construction (70) (64) (47)
Gain on sale of assets (1) (1)
(11)
Deferred income taxes and
tax credits, net 593 43 (287)
Other changes in noncurrent assets
and liabilities (25) 188 116
Effect of changes in operating assets
and liabilities:
Accounts
receivable (83) (6) 128
Inventories (59) (41) 34
Accounts
payable (137) (196) 21
Income taxes receivable/payable 43 56 28
Regulatory balancing accounts, net (394) (567) 329
Other current assets (223) 170 (273)
Other current liabilities 90 24 (235)
Other (5) (45) (13)
Net cash provided by
operating
activities $2,766 $2,541 $2,577
During 2008, net cash provided by operating activities
was approximately $2,766 million, refl ecting net income of
$1,199 million, adjusted for noncash depreciation, amortiza-
tion, and decommissioning and allowance for equity funds
used during construction of $1,838 million and $70 million,
respectively (see “Results of Operations” above). Additionally,
the following change in operating assets and liabilities posi-
tively impacted cash fl ows during the period:
• Liabilities for deferred income taxes and tax credits
increased by approximately $593 million in 2008, primarily
due to an increase in balancing account revenues, which
are not taxable until billed, as well as an increase in deduct-
ible tax depreciation as authorized by the 2008 Economic
Stimulus Act.