PG&E 2008 Annual Report Download - page 132
Download and view the complete annual report
Please find page 132 of the 2008 PG&E annual report below. You can navigate through the pages in the report by either clicking on the pages listed below, or by using the keyword search tool below to find specific information within the annual report.-
 1
1 -
2
-
3
-
4
-
5
-
6
-
7
-
8
-
9
-
10
-
11
-
12
-
13
-
14
-
15
-
16
-
17
-
18
-
19
-
20
-
21
-
22
-
23
-
24
-
25
-
26
-
27
-
28
-
29
-
30
-
31
-
32
-
33
-
34
-
35
-
36
-
37
-
38
-
39
-
40
-
41
-
42
-
43
-
44
-
45
-
46
-
47
-
48
-
49
-
50
-
51
-
52
-
53
-
54
-
55
-
56
-
57
-
58
-
59
-
60
-
61
-
62
-
63
-
64
-
65
-
66
-
67
-
68
-
69
-
70
-
71
-
72
-
73
-
74
-
75
-
76
-
77
-
78
-
79
-
80
-
81
-
82
-
83
-
84
-
85
-
86
-
87
-
88
-
89
-
90
-
91
-
92
-
93
-
94
-
95
-
96
-
97
-
98
-
99
-
100
-
101
-
102
-
103
-
104
-
105
-
106
-
107
-
108
-
109
-
110
-
111
-
112
-
113
-
114
-
115
-
116
-
117
-
118
-
119
-
120
-
121
-
 122
122 -
 123
123 -
 124
124 -
 125
125 -
 126
126 -
 127
127 -
 128
128 -
 129
129 -
 130
130 -
 131
131 -
 132
132 -
 133
133 -
 134
134 -
 135
135 -
 136
136 -
 137
137 -
 138
138 -
 139
139 -
 140
140 -
 141
141 -
 142
142 -
143
-
144
-
145
-
146
-
147
-
148
-
149
-
150
-
151
-
152
-
153
-
154
-
155
-
156
 |
 |

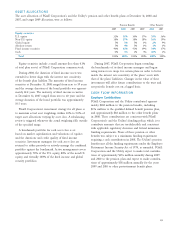
130
return of 4.6%. The rate used to discount pension and other
postretirement benefi t plan liabilities was based on a yield
curve developed from market data of over 300 Aa-grade
non-callable bonds at December 31, 2008. This yield curve
has discount rates that vary based on the duration of the
obligations. The estimated future cash fl ows for the pension
and other benefi t obligations were matched to the corre-
sponding rates on the yield curve to derive a weighted
average discount rate.
The difference between actual and expected return on
plan assets is included in unrecognized gain (loss) and
is considered in the determination of future net periodic
benefi t income (cost). The actual return on plan assets was
above the expected return in 2007 and 2006. The actual
return on plan assets for 2008 was lower than the expected
return due to the signifi cant decline in equity market values
that occurred in 2008.
The assumed health care cost trend rate for 2008
is approximately 8%, decreasing gradually to an ultimate
trend rate in 2014 and beyond of approximately 5%. A one-
percentage-point change in assumed health care cost trend
rate would have the following effects:
One-Percentage- One-Percentage-
(in millions) Point Increase Point Decrease
Effect on postretirement
benefi t obligation $68 $(57)
Effect on service and interest cost 7 (6)
Expected rates of return on plan assets were developed
by determining projected stock and bond returns and then
applying these returns to the target asset allocations of the
employee benefi t trusts, resulting in a weighted average rate
of return on plan assets. Fixed income returns were projected
based on real maturity and credit spreads added to a long-
term infl ation rate. Equity returns were estimated based on
estimates of dividend yield and real earnings growth added
to a long-term rate of infl ation. For the Utility pension plan,
the assumed return of 7.3% compares to a ten-year actual
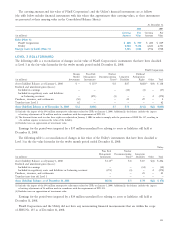
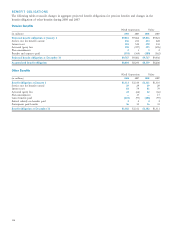
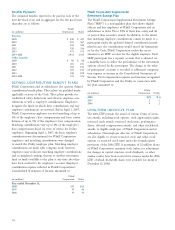
The estimated amounts that will be amortized into net periodic benefi t cost in 2009 are as follows:
(in millions) PG&E Corporation Utility
Pension benefi ts:
Unrecognized prior service cost $ 47 $ 48
Unrecognized net loss 98 97
Total $145 $145
Other benefi ts:
Unrecognized prior service cost $ 16 $ 16
Unrecognized net loss 3 3
Unrecognized net transition obligation 26 26
Total $ 45 $ 45
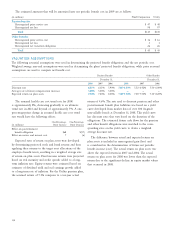
VALUATION ASSUMPTIONS
The following actuarial assumptions were used in determining the projected benefi t obligations and the net periodic cost.
Weighted average year-end assumptions were used in determining the plans’ projected benefi t obligations, while prior year-end
assumptions are used to compute net benefi t cost.
Pension Benefi ts Other Benefi ts
December 31, December 31,
2008 2007 2006 2008 2007 2006
Discount rate 6.31% 6.31% 5.90% 5.85–6.33% 5.52–6.42% 5.50–6.00%
Average rate of future compensation increases 5.00% 5.00% 5.00% — — —
Expected return on plan assets 7.30% 7.40% 8.00% 7.00–7.30% 7.00–7.50% 7.30–8.20%