PG&E 2008 Annual Report Download - page 105
Download and view the complete annual report
Please find page 105 of the 2008 PG&E annual report below. You can navigate through the pages in the report by either clicking on the pages listed below, or by using the keyword search tool below to find specific information within the annual report.-
 1
1 -
2
-
3
-
4
-
5
-
6
-
7
-
8
-
9
-
10
-
11
-
12
-
13
-
14
-
15
-
16
-
17
-
18
-
19
-
20
-
21
-
22
-
23
-
24
-
25
-
26
-
27
-
28
-
29
-
30
-
31
-
32
-
33
-
34
-
35
-
36
-
37
-
38
-
39
-
40
-
41
-
42
-
43
-
44
-
45
-
46
-
47
-
48
-
49
-
50
-
51
-
52
-
53
-
54
-
55
-
56
-
57
-
58
-
59
-
60
-
61
-
62
-
63
-
64
-
65
-
66
-
67
-
68
-
69
-
70
-
71
-
72
-
73
-
74
-
75
-
76
-
77
-
78
-
79
-
80
-
81
-
82
-
83
-
84
-
85
-
86
-
87
-
88
-
89
-
90
-
91
-
92
-
93
-
94
-
 95
95 -
 96
96 -
 97
97 -
 98
98 -
 99
99 -
 100
100 -
 101
101 -
 102
102 -
 103
103 -
 104
104 -
 105
105 -
 106
106 -
 107
107 -
 108
108 -
 109
109 -
 110
110 -
 111
111 -
 112
112 -
 113
113 -
 114
114 -
 115
115 -
116
-
117
-
118
-
119
-
120
-
121
-
122
-
123
-
124
-
125
-
126
-
127
-
128
-
129
-
130
-
131
-
132
-
133
-
134
-
135
-
136
-
137
-
138
-
139
-
140
-
141
-
142
-
143
-
144
-
145
-
146
-
147
-
148
-
149
-
150
-
151
-
152
-
153
-
154
-
155
-
156
 |
 |

103
The Utility is generally authorized to recover 100% of its
electric fuel and energy procurement costs. The Utility fi les
annual forecasts of purchased power costs that it expects to
incur during the following year and rates are set to recover
such expected costs. The energy resource recovery account
tracks actual electric costs and recoveries of fuel and energy
procurement costs, excluding the DWR’s contract costs. The
CPUC has established a mechanism to adjust the Utility’s
rates whenever the forecasted aggregate over-collections or
under-collections of the Utility’s electric procurement costs
for the current year exceed 5% of the Utility’s prior year
generation revenues, excluding generation revenues for DWR
contracts. In accordance with this mechanism, on August 21,
2008, the CPUC approved the Utility’s request to collect
from customers the forecasted 2008 end-of-year under-
collection of procurement costs, due mainly to rising natural
gas costs and lower than forecasted hydroelectric generation.
Effective October 1, 2008, customer rates were adjusted to
allow the Utility to collect $645 million in procurement
costs through December 2009. On December 30, 2008, the
Utility requested that its electric rates be adjusted, effective
January 1, 2009, to refl ect the revised forecast of electricity
prices, which are expected to be lower than originally fore-
casted as a result of lower natural gas prices. The January 1,
2009 rate changes refl ect a net decrease of $101 million in
electric revenues versus revenues based on rates effective
October 1, 2008.
The modifi ed transition cost balancing account is used to
track the recovery of ongoing competition transition costs
(“CTC”), primarily consisting of above-market costs associ-
ated with power purchase contracts that were being collected
in CPUC-approved rates on or before December 20, 1995
(including costs incurred by the Utility with CPUC approval
to restructure, renegotiate, or terminate the contracts). The
recovery of ongoing CTC can continue for the term of the
contract. The amount of above-market costs associated with
the eligible power purchase contracts is determined each
year in the ERRA forecast proceeding by comparing the
ongoing CTC-eligible contract costs to a CPUC-approved
market benchmark to determine whether there are stranded
costs associated with these contracts.
The transmission revenue balancing account tracks certain
electric transmission revenues for recovery from customers.
The balance in this account represents the difference between
transmission wheeling revenues received by the Utility from
the ISO (on behalf of electric transmission wholesale cus-
tomers) and refunds to customers plus interest.
Current Regulatory Liabilities
As of December 31, 2008 and 2007, the Utility had current
regulatory liabilities of approximately $313 million and
$280 million, respectively, primarily consisting of the current
portion of electric transmission wheeling revenue refunds
and amounts that the Utility expects to refund to customers
for over-collected electric transmission rates. Current regula-
tory liabilities are included in Current Liabilities — Other
in the Consolidated Balance Sheets.
REGULATORY BALANCING ACCOUNTS
The Utility uses revenue regulatory balancing accounts
to accumulate differences between revenues and the Utility’s
authorized revenue requirements and cost regulatory
balancing accounts to accumulate differences between
incurred costs and revenues. Under-collections that are
probable of recovery through regulated rates are recorded
as regulatory balancing account assets. Over-collections
that are probable of being credited to customers are recorded
as regulatory balancing account liabilities.
The Utility’s current regulatory balancing accounts accu-
mulate balances until they are refunded to or received from
the Utility’s customers through authorized rate adjustments
within the next 12 months. Regulatory balancing accounts
that the Utility does not expect to collect or refund in the
next 12 months are included in Other Noncurrent Assets —
Regulatory assets and Noncurrent Liabilities — Regulatory
liabilities in the Consolidated Balance Sheets. The CPUC
does not allow the Utility to offset regulatory balancing
account assets against regulatory balancing account liabilities.
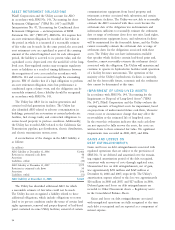
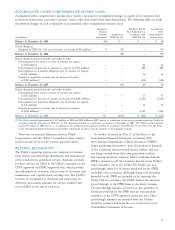
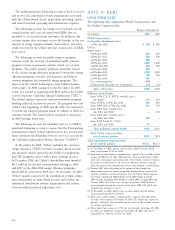
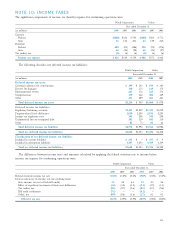
Current Regulatory Balancing Accounts
Receivable (Payable)
Balance at December 31,
(in millions) 2008 2007
Energy resource recovery $ 384 $ 149
Modifi ed transition cost 214 93
Transmission revenue 173 203
Utility generation 164 90
Energy Recovery Bonds (231) (274)
Public purpose programs (264) (16)
Reliability services 12 (96)
Other 15 (51)
Total regulatory balancing accounts, net $ 467 $ 98