OfficeMax 2010 Annual Report Download - page 98
Download and view the complete annual report
Please find page 98 of the 2010 OfficeMax annual report below. You can navigate through the pages in the report by either clicking on the pages listed below, or by using the keyword search tool below to find specific information within the annual report.-
 1
1 -
2
-
3
-
4
-
5
-
6
-
7
-
8
-
9
-
10
-
11
-
12
-
13
-
14
-
15
-
16
-
17
-
18
-
19
-
20
-
21
-
22
-
23
-
24
-
25
-
26
-
27
-
28
-
29
-
30
-
31
-
32
-
33
-
34
-
35
-
36
-
37
-
38
-
39
-
40
-
41
-
42
-
43
-
44
-
45
-
46
-
47
-
48
-
49
-
50
-
51
-
52
-
53
-
54
-
55
-
56
-
57
-
58
-
59
-
60
-
61
-
62
-
63
-
64
-
65
-
66
-
67
-
68
-
69
-
70
-
71
-
72
-
73
-
74
-
75
-
76
-
77
-
78
-
79
-
80
-
81
-
82
-
83
-
84
-
85
-
86
-
87
-
 88
88 -
 89
89 -
 90
90 -
 91
91 -
 92
92 -
 93
93 -
 94
94 -
 95
95 -
 96
96 -
 97
97 -
 98
98 -
 99
99 -
 100
100 -
 101
101 -
 102
102 -
 103
103 -
 104
104 -
 105
105 -
 106
106 -
 107
107 -
 108
108 -
109
-
110
-
111
-
112
-
113
-
114
-
115
-
116
-
117
-
118
-
119
-
120
 |
 |

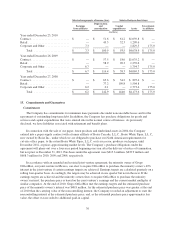
has gone to trial, and the nature of these cases makes any prediction as to the outcome of pending litigation
inherently subjective. At this time, however, we believe our involvement in asbestos litigation is not material to
either our financial position or our results of operations.
17. Quarterly Results of Operations (unaudited)
Summarized quarterly financial data is as follows:
2010 2009
First(a) Second(b) Third Fourth(c) First(d) Second(e) Third(f) Fourth(g)
(millions, except per-share and stock price information)
Sales ...................... $1,917.3 $1,653.2 $1,813.4 $1,766.2 $1,911.7 $1,657.9 $1,831.9 $1,810.5
Gross Profit ................. $ 505.5 $ 427.7 $ 470.4 $ 446.0 $ 465.6 $ 394.9 $ 434.7 $ 442.4
Percent of sales .......... 26.4% 25.9% 25.9% 25.3% 24.4% 23.8% 23.7% 24.4%
Operating income ............ $ 49.4 $ 28.1 $ 40.9 $ 28.1 $ 27.5 $ (27.5) $ 25.2 $ (29.2)
Net income (loss) available to
OfficeMax common
shareholders ............... $ 24.8 $ 11.8 $ 20.0 $ 12.1 $ 13.1 $ (17.7) $ 5.7 $ (3.2)
Net income (loss) per common
share available to OfficeMax
common shareholders(h)
Basic .................. $ 0.29 $ 0.14 $ 0.23 $ 0.14 $ 0.17 $ (0.23) $ 0.07 $ (0.04)
Diluted ................. $ 0.29 $ 0.14 $ 0.23 $ 0.14 $ 0.17 $ (0.23) $ 0.07 $ (0.04)
Common stock dividends paid
per share .................————————
Common stock prices(i)
High ................... $ 17.34 $ 19.79 $ 15.81 $ 19.20 $ 8.44 $ 9.49 $ 13.92 $ 14.50
Low ................... $ 12.60 $ 14.21 $ 9.67 $ 12.73 $ 1.86 $ 2.88 $ 4.81 $ 9.58
(a) Includes a $13.4 million pre-tax charge related to Retail store closures in the U.S., and a $0.8 million pre-tax
charge for severance related to Contract reorganizations.
(b) Includes a $1.1 million pre-tax charge related to Retail store closures in the U.S., and a $3.9 million of
pre-tax income related to the adjustment of a reserve associated with our legacy building materials
manufacturing facility near Elma, Washington.
(c) Includes an $11.0 million non-cash pre-tax charge to impair fixed assets associated with our Retail stores in
the U.S., $2.8 million of pre-tax income related to the adjustment of previously established reserves for
severance and store closures and a $5.5 million of pre-tax income related to the adjustment of a reserve
associated with our legacy building materials manufacturing facility near Elma, Washington.
(d) Includes a $9.9 million pre-tax charge related to Retail store closures in the U.S., and a pre-tax benefit of
$2.6 million recorded as other income related to tax distributions on the Boise Investment.
(e) Includes a $21.3 million pre-tax charge primarily related to Retail store closures in the U.S., a $6.9 million
pre-tax severance charge recorded in the Contract segment, and a pre-tax benefit of $4.4 million recorded as
interest income related to a tax escrow balance established in a prior period in connection with our legacy
Voyageur Panel business sold in 2004.
(f) Includes a $1.5 million pre-tax severance charge recorded in the Contract segment.
(g) Includes a $17.6 million non-cash pre-tax charge to impair fixed assets associated with our Retail stores in
the U.S. and Mexico and $9.6 million of pre-tax severance and other charges, principally related to
reorganizations of our U.S. and Canadian Contract sales forces and customer fulfillment centers, as well as a
streamlining of our Retail store staffing. Also includes the release of $14.9 million in tax uncertainty
reserves related to the deductibility of interest on certain of our industrial revenue bonds.
(h) Quarters added together may not equal full year amount because each quarter is calculated on a stand-alone
basis.
(i) The Company’s common stock (symbol OMX) is traded on the New York Stock Exchange.
78