OfficeMax 2010 Annual Report Download - page 46
Download and view the complete annual report
Please find page 46 of the 2010 OfficeMax annual report below. You can navigate through the pages in the report by either clicking on the pages listed below, or by using the keyword search tool below to find specific information within the annual report.-
 1
1 -
2
-
3
-
4
-
5
-
6
-
7
-
8
-
9
-
10
-
11
-
12
-
13
-
14
-
15
-
16
-
17
-
18
-
19
-
20
-
21
-
22
-
23
-
24
-
25
-
26
-
27
-
28
-
29
-
30
-
31
-
32
-
33
-
34
-
35
-
 36
36 -
 37
37 -
 38
38 -
 39
39 -
 40
40 -
 41
41 -
 42
42 -
 43
43 -
 44
44 -
 45
45 -
 46
46 -
 47
47 -
 48
48 -
 49
49 -
 50
50 -
 51
51 -
 52
52 -
 53
53 -
 54
54 -
 55
55 -
 56
56 -
57
-
58
-
59
-
60
-
61
-
62
-
63
-
64
-
65
-
66
-
67
-
68
-
69
-
70
-
71
-
72
-
73
-
74
-
75
-
76
-
77
-
78
-
79
-
80
-
81
-
82
-
83
-
84
-
85
-
86
-
87
-
88
-
89
-
90
-
91
-
92
-
93
-
94
-
95
-
96
-
97
-
98
-
99
-
100
-
101
-
102
-
103
-
104
-
105
-
106
-
107
-
108
-
109
-
110
-
111
-
112
-
113
-
114
-
115
-
116
-
117
-
118
-
119
-
120
 |
 |
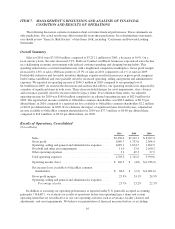
Liquidity and Capital Resources
At the end of fiscal year 2010, the total liquidity available for OfficeMax was $1,038.7 million. This
includes cash and cash equivalents of $462.3 million and borrowing availability of $576.4 million. The
borrowing availability included $472.2 million and $49.2 million relating to our U.S. and Canadian revolving
credit agreements, respectively, as well as $55.0 million relating to our credit agreement associated with our
subsidiaries in Australia and New Zealand (“Australasian Credit Agreement”). At the end of fiscal year 2010, the
Company was in compliance with all material covenants under the three credit agreements. The U.S. and
Canadian credit agreements expire on July 12, 2012 and the Australasian Credit Agreement expires on March 15,
2013. At the end of fiscal year 2010, we had $275.0 million of short-term and long-term debt and
$1,470.0 million of non-recourse timber securitization notes outstanding.
Our primary ongoing cash requirements relate to working capital, expenditures for property and equipment,
technology enhancements and upgrades, lease obligations, pension funding and debt service. We expect to fund
these requirements through a combination of available cash balance and cash flow from operations. We also have
revolving credit facilities as additional liquidity. The following sections of this Management’s Discussion and
Analysis of Financial Condition and Results of Operations discuss in more detail our operating, investing, and
financing activities, as well as our financing arrangements.
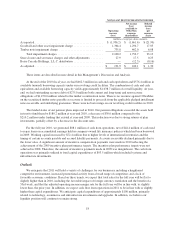
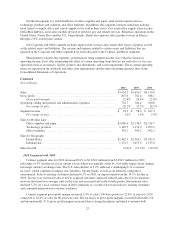
Operating Activities
Our operating activities generated cash of $88.1 million in 2010. Cash from operations in 2010 was net of
$44.4 million of payments of loans on company-owned life insurance policies (“COLI policies”) as well as $72.4
million of increased working capital primarily from larger holdings of our international inventories and the
timing of repayments and obligations. U.S. inventories declined in part due to the lower sales, while our Contract
segment’s international businesses’ inventories increased primarily due to the timing of purchases related to
vendor pricing and product availability. Cash from operations benefitted from lower receivables, primarily due to
the decline in sales, with days sales outstanding essentially flat. In addition, cash from operations in 2010
included the impact of approximately $58 million of incentive compensation payments made associated with the
achievement of the 2009 incentive plan performance targets.
The cash generated from operating activities in 2009 included a significant reduction of inventories ($164.0
million decrease), the initial borrowing against COLI policies ($45.7 million), and income tax refunds of $71.0
million. The incentive plan performance targets were not achieved in 2008. Therefore, the amount of incentive
payments made in 2009 was insignificant.
We sponsor noncontributory defined benefit pension plans covering certain terminated employees, vested
employees, retirees, and some active employees, primarily in Contract. Pension expense was $7.3 million,
$14.1 million and $4.2 million for the years ended December 25, 2010, December 26, 2009 and December 27,
2008, respectively. In 2010, 2009 and 2008, we made cash contributions to our pension plans totaling
$3.4 million, $6.8 million and $13.1 million, respectively. In 2009, we also contributed 8.3 million shares of
OfficeMax common stock to our qualified pension plans. Based on actuarial estimates, this additional
contribution is expected to reduce our minimum required funding contributions by approximately $100 million
for the period from 2010 to 2014. As of the end of 2010, the estimated minimum required funding contribution in
2011 is approximately $6.7 million and the expense is projected to be $9.6 million compared to expense of
$7.3 million in 2010. However, tests required by the Pension Protection Act of 2006, which are to be performed
late in the first quarter of 2011, could result in the acceleration of approximately $17 million of contributions
from future years into 2011. In addition, we may elect to make additional voluntary contributions. See “Critical
Accounting Estimates” in this Management’s Discussion and Analysis of Financial Condition and Results of
Operations for more information.
26