OfficeMax 2010 Annual Report Download - page 94
Download and view the complete annual report
Please find page 94 of the 2010 OfficeMax annual report below. You can navigate through the pages in the report by either clicking on the pages listed below, or by using the keyword search tool below to find specific information within the annual report.-
 1
1 -
2
-
3
-
4
-
5
-
6
-
7
-
8
-
9
-
10
-
11
-
12
-
13
-
14
-
15
-
16
-
17
-
18
-
19
-
20
-
21
-
22
-
23
-
24
-
25
-
26
-
27
-
28
-
29
-
30
-
31
-
32
-
33
-
34
-
35
-
36
-
37
-
38
-
39
-
40
-
41
-
42
-
43
-
44
-
45
-
46
-
47
-
48
-
49
-
50
-
51
-
52
-
53
-
54
-
55
-
56
-
57
-
58
-
59
-
60
-
61
-
62
-
63
-
64
-
65
-
66
-
67
-
68
-
69
-
70
-
71
-
72
-
73
-
74
-
75
-
76
-
77
-
78
-
79
-
80
-
81
-
82
-
83
-
 84
84 -
 85
85 -
 86
86 -
 87
87 -
 88
88 -
 89
89 -
 90
90 -
 91
91 -
 92
92 -
 93
93 -
 94
94 -
 95
95 -
 96
96 -
 97
97 -
 98
98 -
 99
99 -
 100
100 -
 101
101 -
 102
102 -
 103
103 -
 104
104 -
105
-
106
-
107
-
108
-
109
-
110
-
111
-
112
-
113
-
114
-
115
-
116
-
117
-
118
-
119
-
120
 |
 |

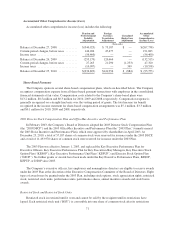
2.2%, expected life of 3.0 years and expected stock price volatility of 87.3%. The risk-free interest rate
assumptions are based on the applicable Treasury bill rates over the options’ expected lives; the expected life
assumptions are based on the time period stock options are expected to be outstanding based on historical
experience; and the expected stock price volatility assumptions are based on the historical and implied volatility
of the Company’s common stock. The Company did not grant any stock options during 2008.
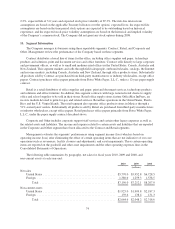
14. Segment Information
The Company manages its business using three reportable segments: Contract, Retail, and Corporate and
Other. Management reviews the performance of the Company based on these segments.
Contract distributes a broad line of items for the office, including office supplies and paper, technology
products and solutions, print and document services and office furniture. Contract sells directly to large corporate
and government offices, as well as to small and medium-sized offices in the United States, Canada, Australia and
New Zealand. This segment markets and sells through field salespeople, outbound telesales, catalogs, the Internet
and in some markets, including Canada, Australia and New Zealand, through office products stores. Substantially
all products sold by Contract are purchased from third-party manufacturers or industry wholesalers, except office
papers. Contract purchases office papers primarily from Boise White Paper, L.L.C., under a 12-year paper supply
contract.
Retail is a retail distributor of office supplies and paper, print and document services, technology products
and solutions and office furniture. In addition, this segment contracts with large national retail chains to supply
office and school supplies to be sold in their stores. Retail office supply stores feature OfficeMax ImPress, an
in-store module devoted to print-for-pay and related services. Retail has operations in the United States, Puerto
Rico and the U.S. Virgin Islands. The retail segment also operates office products stores in Mexico through a
51%-owned joint venture. Substantially all products sold by Retail are purchased from third-party manufacturers
or industry wholesalers, except office papers. Retail purchases office papers primarily from Boise White Paper,
L.L.C., under the paper supply contract described above.
Corporate and Other includes corporate support staff services and certain other legacy expenses as well as
the related assets and liabilities. The income and expense related to certain assets and liabilities that are reported
in the Corporate and Other segment have been allocated to the Contract and Retail segments.
Management evaluates the segments’ performances using segment income (loss) which is based on
operating income (loss) after eliminating the effect of certain operating items that are not indicative of our core
operations such as severances, facility closures and adjustments, and asset impairments. These certain operating
items are reported on the goodwill and other asset impairments and the other operating expenses lines in the
Consolidated Statements of Operations.
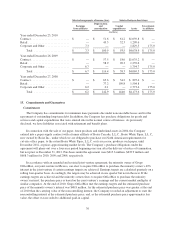
The following table summarizes by geography, net sales for fiscal years 2010, 2009 and 2008, and
non-current assets at each year-end:
2010 2009 2008
(millions)
Net sales
United States ................................................. $5,770.0 $5,952.8 $6,728.5
Foreign ..................................................... 1,380.0 1,259.3 1,538.5
Total ................................................... $7,150.0 $7,212.1 $8,267.0
Non-current assets
United States ................................................. $1,925.0 $1,909.8 $2,187.3
Foreign ..................................................... 139.6 138.4 131.3
Total ................................................... $2,064.6 $2,048.2 $2,318.6
74