OfficeMax 2010 Annual Report Download - page 63
Download and view the complete annual report
Please find page 63 of the 2010 OfficeMax annual report below. You can navigate through the pages in the report by either clicking on the pages listed below, or by using the keyword search tool below to find specific information within the annual report.-
 1
1 -
2
-
3
-
4
-
5
-
6
-
7
-
8
-
9
-
10
-
11
-
12
-
13
-
14
-
15
-
16
-
17
-
18
-
19
-
20
-
21
-
22
-
23
-
24
-
25
-
26
-
27
-
28
-
29
-
30
-
31
-
32
-
33
-
34
-
35
-
36
-
37
-
38
-
39
-
40
-
41
-
42
-
43
-
44
-
45
-
46
-
47
-
48
-
49
-
50
-
51
-
52
-
 53
53 -
 54
54 -
 55
55 -
 56
56 -
 57
57 -
 58
58 -
 59
59 -
 60
60 -
 61
61 -
 62
62 -
 63
63 -
 64
64 -
 65
65 -
 66
66 -
 67
67 -
 68
68 -
 69
69 -
 70
70 -
 71
71 -
 72
72 -
 73
73 -
74
-
75
-
76
-
77
-
78
-
79
-
80
-
81
-
82
-
83
-
84
-
85
-
86
-
87
-
88
-
89
-
90
-
91
-
92
-
93
-
94
-
95
-
96
-
97
-
98
-
99
-
100
-
101
-
102
-
103
-
104
-
105
-
106
-
107
-
108
-
109
-
110
-
111
-
112
-
113
-
114
-
115
-
116
-
117
-
118
-
119
-
120
 |
 |

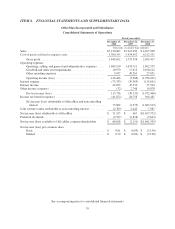
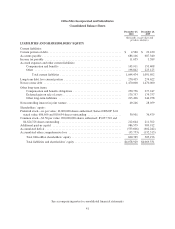
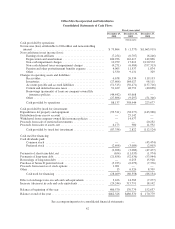
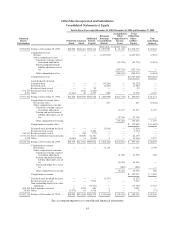
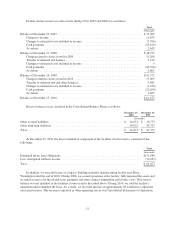
OfficeMax Incorporated and Subsidiaries
Consolidated Statements of Equity
For the Fiscal Years ended December 25, 2010, December 26, 2009 and December 27, 2008
Common
Shares
Outstanding
Preferred
Stock
Common
Stock
Additional
Paid-In
Capital
Retained
Earnings
(Accumulated
Deficit)
Accumulated
Other
Comprehensive
Income
(Loss)
Total
OfficeMax
Share-
holders’
Equity
Non-
controlling
Interest
(thousands, except per share)
75,397,094 Balance at December 29, 2007 ..... $49,989 $188,481 $922,414 $ 1,095,950 $ 21,738 $ 2,278,572 $ 32,042
Comprehensive loss:
Net loss ..................... — — — (1,657,932) — (1,657,932) (7,987)
Other comprehensive loss:
Cumulative foreign currency
translation adjustment ...... (83,758) (83,758) (6,894)
Pension and postretirement
liability adjustment, net of
tax......................
(205,718) (205,718) —
Other comprehensive loss ..... (289,476) (289,476) (6,894)
Comprehensive loss $(1,947,408) $(14,881)
Cash dividends declared:
Common stock ................. — — — (34,220) — (34,220) —
Preferred stock ................. — — — (3,663) — (3,663) —
Restricted stock issued ........... — — 93 — — 93 —
571,727 Restricted stock vested ........... — 1,436 (1,436) — — — —
8,331 Other ......................... (7,424) 26 4,257 (230) (3,371) 4,710
75,977,152 Balance at December 27, 2008 ..... $42,565 $189,943 $925,328 $ (600,095) $(267,738) $ 290,003 $ 21,871
Comprehensive income (loss):
Net income (loss) ............. — — — 667 — 667 (2,242)
Other comprehensive income:
Cumulative foreign currency
translation adjustment ...... 47,477 47,477 1,157
Pension and postretirement
liability adjustment, net of
tax ..................... 87,746 87,746 —
Other comprehensive income . . 135,223 135,223 1,157
Comprehensive income (loss) ...... $ 135,890 $ (1,085)
Preferred stock dividend declared . . . — — — (2,818) — (2,818) —
Restricted stock issued ........... — — 6,130 — — 6,130 —
313,517 Restricted stock vested ........... — 784 (777) — — 7 —
8,331,722 Stock contribution to pension plan . . — 20,829 61,321 — — 82,150 —
2,335 Other ......................... (6,086) 6 (2,090) 4 — (8,166) 7,273
84,624,726 Balance at December 26, 2009 ..... $36,479 $211,562 $989,912 $ (602,242) $(132,515) $ 503,196 $ 28,059
Comprehensive income:
Net income .................. — — — 71,155 — 71,155 2,709
Other comprehensive income:
Cumulative foreign currency
translation adjustment ...... 21,290 21,290 786
Pension and postretirement
liability adjustment, net of
tax ..................... 16,356 16,356 —
Unrealized hedge loss, net of
tax ..................... (884) (884) —
Other comprehensive income . . 36,762 36,762 786
Comprehensive income $ 107,917 $ 3,495
Preferred stock dividend declared . . . — — — (2,527) (2,527) —
Restricted stock issued ........... — — 7,972 — — 7,972 —
Non-controlling interest fair value
adjustment ................... — — (17,763) — — (17,763) 17,763
408,519 Stock options exercised ........... — 1,021 940 — — 1,961 —
24,465 Other ......................... (5,578) 61 5,518 8 — 9 (71)
85,057,710 Balance at December 25, 2010 ..... $30,901 $212,644 $986,579 $ (533,606) $ (95,753) $ 600,765 $ 49,246
See accompanying notes to consolidated financial statements
43