OfficeMax 2010 Annual Report Download - page 38
Download and view the complete annual report
Please find page 38 of the 2010 OfficeMax annual report below. You can navigate through the pages in the report by either clicking on the pages listed below, or by using the keyword search tool below to find specific information within the annual report.-
 1
1 -
2
-
3
-
4
-
5
-
6
-
7
-
8
-
9
-
10
-
11
-
12
-
13
-
14
-
15
-
16
-
17
-
18
-
19
-
20
-
21
-
22
-
23
-
24
-
25
-
26
-
27
-
 28
28 -
 29
29 -
 30
30 -
 31
31 -
 32
32 -
 33
33 -
 34
34 -
 35
35 -
 36
36 -
 37
37 -
 38
38 -
 39
39 -
 40
40 -
 41
41 -
 42
42 -
 43
43 -
 44
44 -
 45
45 -
 46
46 -
 47
47 -
 48
48 -
49
-
50
-
51
-
52
-
53
-
54
-
55
-
56
-
57
-
58
-
59
-
60
-
61
-
62
-
63
-
64
-
65
-
66
-
67
-
68
-
69
-
70
-
71
-
72
-
73
-
74
-
75
-
76
-
77
-
78
-
79
-
80
-
81
-
82
-
83
-
84
-
85
-
86
-
87
-
88
-
89
-
90
-
91
-
92
-
93
-
94
-
95
-
96
-
97
-
98
-
99
-
100
-
101
-
102
-
103
-
104
-
105
-
106
-
107
-
108
-
109
-
110
-
111
-
112
-
113
-
114
-
115
-
116
-
117
-
118
-
119
-
120
 |
 |

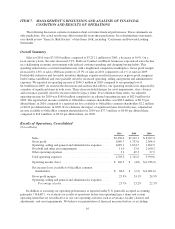
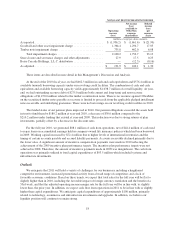
NON-GAAP RECONCILIATION FOR 2008
Operating
income
(loss)
Net income
(loss)
available to
OfficeMax
common
shareholders
Diluted
income
(loss)
per
common
share
(millions, except per-share amounts)
As reported .............................................. $ (1,936.2) $ (1,661.6) $ (21.90)
Goodwill and other asset impairment charge .................... 1,364.4 1,294.7 17.05
Timber note impairment charge .............................. 735.8 462.0 6.08
Total impairment charges ............................... 2,100.2 1,756.7 23.13
Store closure and severance charges and other adjustments ........ 27.9 17.5 0.23
Boise Cascade Holdings, L.L.C. distribution .................... — (12.5) (0.16)
As adjusted .............................................. $ 191.9 $ 100.1 $ 1.30
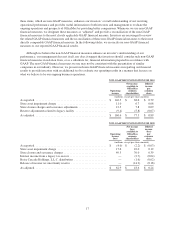
These items are described in more detail in this Management’s Discussion and Analysis.
At the end of the 2010 fiscal year, we had $462.3 million in cash and cash equivalents and $576.4 million in
available (unused) borrowing capacity under our revolving credit facilities. The combination of cash and cash
equivalents and available borrowing capacity yields approximately $1,038.7 million of overall liquidity. At year-
end, we had outstanding recourse debt of $275.0 million (both current and long-term) and non-recourse
obligations of $1,470.0 million related to the timber securitization notes. There is no recourse against OfficeMax
on the securitized timber notes payable as recourse is limited to proceeds from the applicable pledged installment
notes receivable and underlying guarantees. There were no borrowings on our revolving credit facilities in 2010.
The funded status of our pension plans improved in 2010. Our pension obligations exceeded the assets held
in trust to fund them by $180.2 million at year-end 2010, a decrease of $30.0 million compared to the
$210.2 million under funding that existed at year-end 2009. This reduction was due to strong returns of plan
investments, partially offset by a decrease in the discount rates.
For the full year 2010, we generated $88.1 million of cash from operations, net of $44.4 million of cash used
to repay loans on accumulated earnings held in company-owned life insurance policies which had been borrowed
in 2009. Working capital increased by $72.4 million due to higher levels of international inventories and the
timing of certain accounts payable and accrued liability payments. Accounts receivable declined primarily due to
the lower sales. A significant amount of incentive compensation payments were made in 2010 reflecting the
achievement of the 2009 incentive plan performance targets. The incentive plan performance targets were not
achieved in 2008. Therefore, the amount of incentive payments made in 2009 was insignificant. The cash from
operations was primarily utilized to fund capital expenditures of $93.5 million which included systems and
infrastructure investments.
Outlook
We anticipate that 2011 will hold a variety of challenges for our businesses including a heightened
competitive environment, increased promotional activity from a broad range of competitors and a lack of
favorable economic conditions. Based on these trends, we expect that total sales for the full year will be flat to
slightly higher than in 2010, including the favorable impact of foreign currency translation and the benefit of a
53rd week, and that the adjusted operating income margin rate for the full year will be in line with, to slightly
lower than, the prior year. In addition, we expect cash flow from operations in 2011 to be in line with or slightly
higher than capital expenditures. We anticipate capital expenditures of approximately $100 million, primarily
related to technology, ecommerce and infrastructure investments and upgrades. In addition, we believe our
liquidity position will continue to remain strong.
18