OfficeMax 2010 Annual Report Download - page 36
Download and view the complete annual report
Please find page 36 of the 2010 OfficeMax annual report below. You can navigate through the pages in the report by either clicking on the pages listed below, or by using the keyword search tool below to find specific information within the annual report.-
 1
1 -
2
-
3
-
4
-
5
-
6
-
7
-
8
-
9
-
10
-
11
-
12
-
13
-
14
-
15
-
16
-
17
-
18
-
19
-
20
-
21
-
22
-
23
-
24
-
25
-
 26
26 -
 27
27 -
 28
28 -
 29
29 -
 30
30 -
 31
31 -
 32
32 -
 33
33 -
 34
34 -
 35
35 -
 36
36 -
 37
37 -
 38
38 -
 39
39 -
 40
40 -
 41
41 -
 42
42 -
 43
43 -
 44
44 -
 45
45 -
 46
46 -
47
-
48
-
49
-
50
-
51
-
52
-
53
-
54
-
55
-
56
-
57
-
58
-
59
-
60
-
61
-
62
-
63
-
64
-
65
-
66
-
67
-
68
-
69
-
70
-
71
-
72
-
73
-
74
-
75
-
76
-
77
-
78
-
79
-
80
-
81
-
82
-
83
-
84
-
85
-
86
-
87
-
88
-
89
-
90
-
91
-
92
-
93
-
94
-
95
-
96
-
97
-
98
-
99
-
100
-
101
-
102
-
103
-
104
-
105
-
106
-
107
-
108
-
109
-
110
-
111
-
112
-
113
-
114
-
115
-
116
-
117
-
118
-
119
-
120
 |
 |

ITEM 7. MANAGEMENT’S DISCUSSION AND ANALYSIS OF FINANCIAL
CONDITION AND RESULTS OF OPERATIONS
The following discussion contains statements about our future financial performance. These statements are
only predictions. Our actual results may differ materially from these predictions. In evaluating these statements,
you should review “Item 1A. Risk Factors” of this Form 10-K, including “Cautionary and Forward-Looking
Statements.”
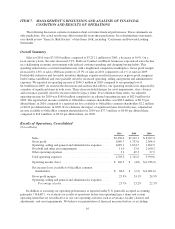
Overall Summary
Sales for 2010 were $7,150.0 million, compared to $7,212.1 million for 2009, a decrease of 0.9%. On a
local currency basis, the sales decreased 2.9%. Both our Contract and Retail businesses experienced sales decline
in a challenging economic environment with reduced customer spending and changing buying habits. This
spending reduction has occurred simultaneously with a heightened competitive marketplace. Gross profit margin
increased by 1.8% of sales (180 basis points) to 25.9% of sales in 2010 compared to 24.1% of sales in 2009.
Profitability initiatives and favorable inventory shrinkage expense resulted in increases in gross profit margin in
both Contract and Retail and were partially offset by increased operating, selling and general and administrative
expenses. We reported an operating income of $146.5 million in 2010 compared to an operating loss of
$4.0 million in 2009. As noted in the discussion and analysis that follows, our operating results were impacted by
a number of significant items in both years. These items included charges for asset impairments, store closures
and severance, partially offset by income related to legacy items. If we eliminate these items, our adjusted
operating income for 2010 was $160.6 million compared to an adjusted operating income of $62.9 million for
2009. The reported net income available to OfficeMax common shareholders was $68.6 million, or $0.79 per
diluted share, in 2010 compared to a reported net loss available to OfficeMax common shareholders $2.2 million,
or $0.03 per diluted share, in 2009. If we eliminate the impact of significant items from both years, adjusted net
income available to OfficeMax common shareholders for 2010 was $77.3 million, or $0.89 per diluted share,
compared to $18.6 million, or $0.24 per diluted share, for 2009.
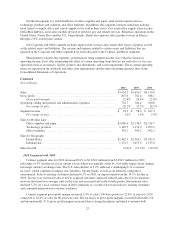
Results of Operations, Consolidated
($ in millions)
2010 2009 2008
Sales ................................................ $7,150.0 $7,212.1 $ 8,267.0
Gross profit .......................................... 1,849.7 1,737.6 2,054.4
Operating, selling and general and administrative expenses ..... 1,689.1 1,674.7 1,862.5
Goodwill and other asset impairments ...................... 11.0 17.6 2,100.2
Other operating expenses ................................ 3.1 49.3 27.9
Total operating expenses ................................ 1,703.2 1,741.6 3,990.6
Operating income (loss) ................................. $ 146.5 $ (4.0) $(1,936.2)
Net income (loss) available to OfficeMax common
shareholders ........................................ $ 68.6 $ (2.2) $(1,661.6)
Gross profit margin .................................... 25.9% 24.1% 24.9%
Operating, selling and general and administrative expenses .....
Percentage of sales ................................ 23.7% 23.2% 22.5%
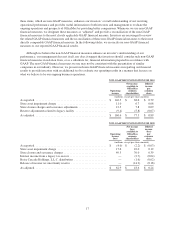
In addition to assessing our operating performance as reported under U.S. generally accepted accounting
principles (“GAAP”), we evaluate our results of operations before non-operating legacy items and certain
operating items that are not indicative of our core operating activities such as severance, facility closures and
adjustments, and asset impairments. We believe our presentation of financial measures before, or excluding,
16