OfficeMax 2010 Annual Report Download - page 89
Download and view the complete annual report
Please find page 89 of the 2010 OfficeMax annual report below. You can navigate through the pages in the report by either clicking on the pages listed below, or by using the keyword search tool below to find specific information within the annual report.-
 1
1 -
2
-
3
-
4
-
5
-
6
-
7
-
8
-
9
-
10
-
11
-
12
-
13
-
14
-
15
-
16
-
17
-
18
-
19
-
20
-
21
-
22
-
23
-
24
-
25
-
26
-
27
-
28
-
29
-
30
-
31
-
32
-
33
-
34
-
35
-
36
-
37
-
38
-
39
-
40
-
41
-
42
-
43
-
44
-
45
-
46
-
47
-
48
-
49
-
50
-
51
-
52
-
53
-
54
-
55
-
56
-
57
-
58
-
59
-
60
-
61
-
62
-
63
-
64
-
65
-
66
-
67
-
68
-
69
-
70
-
71
-
72
-
73
-
74
-
75
-
76
-
77
-
78
-
 79
79 -
 80
80 -
 81
81 -
 82
82 -
 83
83 -
 84
84 -
 85
85 -
 86
86 -
 87
87 -
 88
88 -
 89
89 -
 90
90 -
 91
91 -
 92
92 -
 93
93 -
 94
94 -
 95
95 -
 96
96 -
 97
97 -
 98
98 -
 99
99 -
100
-
101
-
102
-
103
-
104
-
105
-
106
-
107
-
108
-
109
-
110
-
111
-
112
-
113
-
114
-
115
-
116
-
117
-
118
-
119
-
120
 |
 |

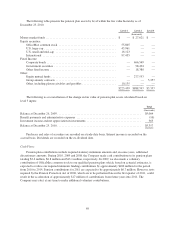
The following table presents the pension plan assets by level within the fair value hierarchy as of
December 25, 2010.
Level 1 Level 2 Level 3
(thousands)
Money market funds ................................................ $ — $ 27,621 $ —
Equity securities:
OfficeMax common stock ....................................... 55,805 — —
U.S. large-cap ................................................. 43,961 — —
U.S. small and mid-cap ......................................... 16.123 — —
International .................................................. 97,435 — —
Fixed Income:
Corporate bonds ............................................... — 466,549 —
Government securities .......................................... — 98,494 —
Other fixed income ............................................. — 18,380 —
Other:
Equity mutual funds ............................................ — 277,553 —
Group annuity contracts ......................................... — — 5,357
Other, including plan receivables and payables ....................... 10,135 — —
$223,459 $888,597 $5,357
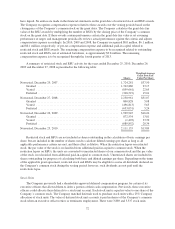
The following is a reconciliation of the change in fair value of pension plan assets calculated based on
level 3 inputs:
Total
(thousands)
Balance at December 26, 2009 ......................................................... $5,004
Benefit payments and administrative expenses ............................................ (10)
Investment income and net appreciation in investments ..................................... 363
Balance at December 25, 2010 ......................................................... $5,357
Purchases and sales of securities are recorded on a trade-date basis. Interest income is recorded on the
accrual basis. Dividends are recorded on the ex-dividend date.
Cash Flows
Pension plan contributions include required statutory minimum amounts and, in some years, additional
discretionary amounts. During 2010, 2009 and 2008, the Company made cash contributions to its pension plans
totaling $3.4 million, $6.8 million and $13.1 million, respectively. In 2009, we also made a voluntary
contribution of OfficeMax common stock to our qualified pension plans which, based on actuarial estimates, is
expected to reduce our required minimum funding contributions by approximately $100 million for the period
from 2010 to 2014. Pension contributions for 2011 are expected to be approximately $6.7 million. However, tests
required by the Pension Protection Act of 2006, which are to be performed late in the first quarter of 2011, could
result in the acceleration of approximately $17 million of contributions from future years into 2011. The
Company may elect at any time to make additional voluntary contributions.
69