OfficeMax 2010 Annual Report Download - page 44
Download and view the complete annual report
Please find page 44 of the 2010 OfficeMax annual report below. You can navigate through the pages in the report by either clicking on the pages listed below, or by using the keyword search tool below to find specific information within the annual report.-
 1
1 -
2
-
3
-
4
-
5
-
6
-
7
-
8
-
9
-
10
-
11
-
12
-
13
-
14
-
15
-
16
-
17
-
18
-
19
-
20
-
21
-
22
-
23
-
24
-
25
-
26
-
27
-
28
-
29
-
30
-
31
-
32
-
33
-
 34
34 -
 35
35 -
 36
36 -
 37
37 -
 38
38 -
 39
39 -
 40
40 -
 41
41 -
 42
42 -
 43
43 -
 44
44 -
 45
45 -
 46
46 -
 47
47 -
 48
48 -
 49
49 -
 50
50 -
 51
51 -
 52
52 -
 53
53 -
 54
54 -
55
-
56
-
57
-
58
-
59
-
60
-
61
-
62
-
63
-
64
-
65
-
66
-
67
-
68
-
69
-
70
-
71
-
72
-
73
-
74
-
75
-
76
-
77
-
78
-
79
-
80
-
81
-
82
-
83
-
84
-
85
-
86
-
87
-
88
-
89
-
90
-
91
-
92
-
93
-
94
-
95
-
96
-
97
-
98
-
99
-
100
-
101
-
102
-
103
-
104
-
105
-
106
-
107
-
108
-
109
-
110
-
111
-
112
-
113
-
114
-
115
-
116
-
117
-
118
-
119
-
120
 |
 |

Retail
($ in millions)
2010 2009 2008
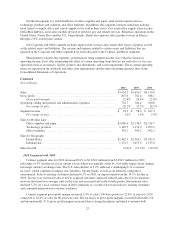
Sales ........................................................... $3,515.8 $3,555.4 $3,957.0
Gross profit ...................................................... 1,022.7 975.2 1,106.3
Gross profit margin ............................................ 29.1% 27.4% 28.0%
Operating, selling and general and administrative expenses ................ 918.8 930.3 1,045.1
Percentage of sales ............................................ 26.1% 26.1% 26.5%
Segment income $ 103.9 $ 44.9 $ 61.2
Percentage of sales ............................................ 3.0% 1.3% 1.5%
Sales by Product Line
Office supplies and paper ....................................... $1,469.2 $1,446.9 $1,551.7
Technology products ........................................... 1,837.8 1,872.6 2,052.6
Office furniture ............................................... 208.8 235.9 352.7
Sales by Geography
United States ................................................. $3,287.5 $3,369.6 $3,693.5
International ................................................. 228.3 185.8 263.5
Sales Growth
Total sales growth ............................................. (1.1)% (10.2)% (7.2)%
Same-location sales growth ...................................... (0.8)% (11.0)% (10.8)%
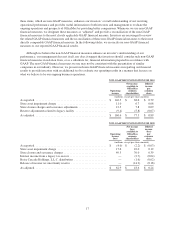
2010 Compared with 2009
Retail segment sales for 2010 decreased by 1.1% (1.5% on a local currency basis) to $3,515.8 million from
$3,555.4 million for 2009 reflecting challenging economic conditions and increased promotional activity. U.S.
same-store sales declined 2.2% for 2010 primarily due to continued weaker consumer and small business
spending and reduced technology sales. Mexico same-store sales for 2010 increased 15.7% on a local currency
basis year-over-year due to unusually lower sales in 2009 resulting from the weakened economy and the H1N1
flu epidemic as well as new sales initiatives in 2010. U.S. store traffic was lower compared to the prior year as
sales declined across all major product categories, but average ticket amounts were up due to a mix shift within
the technology products category to higher-priced items. We ended 2010 with 997 stores. In the U.S., we closed
fifteen retail stores during 2010 and opened none, ending the year with 918 retail stores, while Grupo OfficeMax,
our majority-owned joint venture in Mexico, opened two stores and closed none, ending the year with 79 retail
stores.
Retail segment gross profit margin increased 1.7% of sales (170 basis points) to 29.1% of sales for 2010
compared to 27.4% of sales for the previous year. The gross profit margin increase was due to our product and
pricing initiatives and a sales mix shift to the higher-margin supplies category (which was slightly offset by an
unfavorable mix shift within the technology category) as well as reduced inventory shrinkage expense, lower
occupancy costs due to rent reductions, resulting from lease renewals and renegotiations, and closed stores and
lower freight expense. The reduced inventory shrinkage expense included the reversal of inventory shrinkage
reserves due to favorable results from our annual physical inventory counts of $11.5 million.
Retail segment operating, selling and general and administrative expenses of 26.1% of sales for 2010 were
flat compared to 2009. The current year benefited from favorable trends in workers compensation and medical
benefit expenses, sales/use tax and legal settlements as well as reduced payroll expenses due to closed stores and
store staffing reductions. These benefits were offset by increased expenses resulting from our print-for-pay and
new channel growth initiatives and the impact of property tax and other settlements in 2009.
24