OfficeMax 2010 Annual Report Download - page 39
Download and view the complete annual report
Please find page 39 of the 2010 OfficeMax annual report below. You can navigate through the pages in the report by either clicking on the pages listed below, or by using the keyword search tool below to find specific information within the annual report.-
 1
1 -
2
-
3
-
4
-
5
-
6
-
7
-
8
-
9
-
10
-
11
-
12
-
13
-
14
-
15
-
16
-
17
-
18
-
19
-
20
-
21
-
22
-
23
-
24
-
25
-
26
-
27
-
28
-
 29
29 -
 30
30 -
 31
31 -
 32
32 -
 33
33 -
 34
34 -
 35
35 -
 36
36 -
 37
37 -
 38
38 -
 39
39 -
 40
40 -
 41
41 -
 42
42 -
 43
43 -
 44
44 -
 45
45 -
 46
46 -
 47
47 -
 48
48 -
 49
49 -
50
-
51
-
52
-
53
-
54
-
55
-
56
-
57
-
58
-
59
-
60
-
61
-
62
-
63
-
64
-
65
-
66
-
67
-
68
-
69
-
70
-
71
-
72
-
73
-
74
-
75
-
76
-
77
-
78
-
79
-
80
-
81
-
82
-
83
-
84
-
85
-
86
-
87
-
88
-
89
-
90
-
91
-
92
-
93
-
94
-
95
-
96
-
97
-
98
-
99
-
100
-
101
-
102
-
103
-
104
-
105
-
106
-
107
-
108
-
109
-
110
-
111
-
112
-
113
-
114
-
115
-
116
-
117
-
118
-
119
-
120
 |
 |
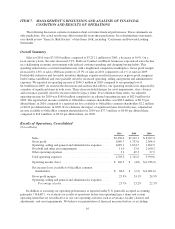
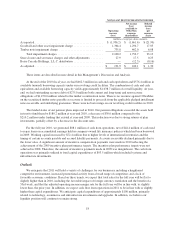
2010 Compared with 2009
Sales for 2010 decreased 0.9% to $7,150.0 million from $7,212.1 million for 2009, which included the
impact of favorable currency exchange rates relating to our international subsidiaries. On a local currency basis,
sales declined 2.9%. Both our Contract and Retail segments experienced year-over-year sales declines in a
challenging economic environment with increased competitive intensity including higher levels of promotional
activity.
Gross profit margin increased by 1.8% of sales (180 basis points) to 25.9% of sales in 2010 compared to
24.1% of sales in 2009. The gross profit margins increased in both our Contract and Retail segments due to our
profitability initiatives and reduced inventory shrinkage expense. We benefited from $15 million of inventory
shrinkage reserve adjustments due to the positive results from our physical inventory counts. Retail segment
gross profit margins also benefitted from a sales mix shift to higher-margin products and lower occupancy and
freight costs.
Operating, selling and general and administrative expenses increased 0.5% of sales to 23.7% of sales in
2010 from 23.2% of sales in 2009. The increase was in our Contract segment, as the Retail segment operating,
selling and general and administrative expenses as a percent of sales remained flat. The increase was the result of
higher expenses related to our growth and profitability initiatives which were partially offset by favorable trends
in workers compensation and medical benefit expenses, lower payroll-related expenses and favorable sales and
use tax and legal settlements in Retail. On a consolidated basis, we recognized $9 million of favorable sales/use
tax settlements and adjustments through the year as well as a $5 million gain related to the resolution of a legal
dispute. These items compare to approximately $10 million of income realized in the prior year related to
favorable property tax settlements and the resolution of a dispute with a service provider.
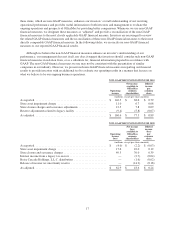
As noted above, our results for 2010 include several significant items, as follows:
• We recognized a non-cash impairment charge of $11.0 million associated with leasehold improvements
and other assets at certain of our Retail stores in the U.S. After tax, this charge reduced net income
available to OfficeMax common shareholders by $6.7 million, or $0.08 per diluted share.
• We recorded $13.1 million of charges in our Retail segment related to store closures in the U.S offset
by income of $0.6 million in our Retail segment to adjust previously established severance reserves.
After tax, the cumulative effect of these items was a reduction of net income available to OfficeMax
common shareholders of $7.8 million, or $0.09 per diluted share.
• We recorded income of $9.4 million related to the adjustment of a reserve associated with our legacy
building materials manufacturing facility near Elma, Washington due to the sale of the facility’s
equipment and the termination of the lease. This item increased net income available to OfficeMax
common shareholders by $5.8 million, or $0.07 per diluted share.
Interest income was $42.6 million and $47.3 million for 2010 and 2009, respectively. The decrease was due
primarily to $4.4 million of interest income recorded in 2009 related to a tax escrow balance established in a
prior period in connection with the sale of our legacy Voyageur Panel business. Interest expense decreased to
$73.3 million in 2010 from $76.4 million in 2009. The decrease in interest expense was due primarily to reduced
debt resulting from payments made in 2009 and 2010.
For 2010, we recognized income tax expense of $41.9 million on pre-tax income of $115.7 million
(effective tax expense rate of 36.2%) compared to income tax benefit of $28.8 million on a pre-tax loss of
$30.3 million (effective tax benefit rate of 94.8%) for 2009. The effective tax rate in both years was impacted by
the effects of state income taxes, income items not subject to tax, non-deductible expenses and the mix of
domestic and foreign sources of income as well as low levels of profitability in 2009. The effective tax rate in
2009 also included $14.9 million from the release of a tax reserve upon the resolution of our claim that interest
on certain of our industrial revenue bonds was fully tax deductible.
19