OfficeMax 2010 Annual Report Download - page 33
Download and view the complete annual report
Please find page 33 of the 2010 OfficeMax annual report below. You can navigate through the pages in the report by either clicking on the pages listed below, or by using the keyword search tool below to find specific information within the annual report.-
 1
1 -
2
-
3
-
4
-
5
-
6
-
7
-
8
-
9
-
10
-
11
-
12
-
13
-
14
-
15
-
16
-
17
-
18
-
19
-
20
-
21
-
22
-
 23
23 -
 24
24 -
 25
25 -
 26
26 -
 27
27 -
 28
28 -
 29
29 -
 30
30 -
 31
31 -
 32
32 -
 33
33 -
 34
34 -
 35
35 -
 36
36 -
 37
37 -
 38
38 -
 39
39 -
 40
40 -
 41
41 -
 42
42 -
 43
43 -
44
-
45
-
46
-
47
-
48
-
49
-
50
-
51
-
52
-
53
-
54
-
55
-
56
-
57
-
58
-
59
-
60
-
61
-
62
-
63
-
64
-
65
-
66
-
67
-
68
-
69
-
70
-
71
-
72
-
73
-
74
-
75
-
76
-
77
-
78
-
79
-
80
-
81
-
82
-
83
-
84
-
85
-
86
-
87
-
88
-
89
-
90
-
91
-
92
-
93
-
94
-
95
-
96
-
97
-
98
-
99
-
100
-
101
-
102
-
103
-
104
-
105
-
106
-
107
-
108
-
109
-
110
-
111
-
112
-
113
-
114
-
115
-
116
-
117
-
118
-
119
-
120
 |
 |

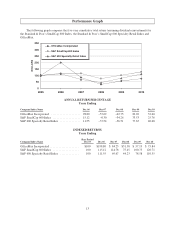
Performance Graph
The following graph compares the five-year cumulative total return (assuming dividend reinvestment) for
the Standard & Poor’s SmallCap 600 Index, the Standard & Poor’s SmallCap 600 Specialty Retail Index and
OfficeMax.
0
50
100
150
200
250
300
350
2005 2006 2007 2008 2009 2010
DOLLARS
OfficeMax Incorporated
S&P SmallCap 600 Index
S&P 600 Specialty Retail Index
ANNUAL RETURN PERCENTAGE
Years Ending
Company\Index Name Dec 06 Dec 07 Dec 08 Dec 09 Dec 10
OfficeMax Incorporated .................... 98.80 –57.62 –62.75 82.26 32.60
S&P SmallCap 600 Index ................... 15.12 –0.30 –34.26 33.53 25.76
S&P 600 Specialty Retail Index .............. 11.55 –37.54 –36.51 77.65 40.68
INDEXED RETURNS
Years Ending
Company\Index Name
Base Period
Dec 05 Dec 06 Dec 07 Dec 08 Dec 09 Dec 10
OfficeMax Incorporated .................... $100 $198.80 $ 84.25 $31.38 $ 57.19 $ 75.84
S&P SmallCap 600 Index .................. 100 115.12 114.78 75.45 100.75 126.71
S&P 600 Specialty Retail Index ............. 100 111.55 69.67 44.23 78.58 110.55
13