OfficeMax 2010 Annual Report Download - page 37
Download and view the complete annual report
Please find page 37 of the 2010 OfficeMax annual report below. You can navigate through the pages in the report by either clicking on the pages listed below, or by using the keyword search tool below to find specific information within the annual report.-
 1
1 -
2
-
3
-
4
-
5
-
6
-
7
-
8
-
9
-
10
-
11
-
12
-
13
-
14
-
15
-
16
-
17
-
18
-
19
-
20
-
21
-
22
-
23
-
24
-
25
-
26
-
 27
27 -
 28
28 -
 29
29 -
 30
30 -
 31
31 -
 32
32 -
 33
33 -
 34
34 -
 35
35 -
 36
36 -
 37
37 -
 38
38 -
 39
39 -
 40
40 -
 41
41 -
 42
42 -
 43
43 -
 44
44 -
 45
45 -
 46
46 -
 47
47 -
48
-
49
-
50
-
51
-
52
-
53
-
54
-
55
-
56
-
57
-
58
-
59
-
60
-
61
-
62
-
63
-
64
-
65
-
66
-
67
-
68
-
69
-
70
-
71
-
72
-
73
-
74
-
75
-
76
-
77
-
78
-
79
-
80
-
81
-
82
-
83
-
84
-
85
-
86
-
87
-
88
-
89
-
90
-
91
-
92
-
93
-
94
-
95
-
96
-
97
-
98
-
99
-
100
-
101
-
102
-
103
-
104
-
105
-
106
-
107
-
108
-
109
-
110
-
111
-
112
-
113
-
114
-
115
-
116
-
117
-
118
-
119
-
120
 |
 |

these items, which are non-GAAP measures, enhances our investors’ overall understanding of our recurring
operational performance and provides useful information to both investors and management to evaluate the
ongoing operations and prospects of OfficeMax by providing better comparisons. Whenever we use non-GAAP
financial measures, we designate these measures as “adjusted” and provide a reconciliation of the non-GAAP
financial measures to the most closely applicable GAAP financial measure. Investors are encouraged to review
the related GAAP financial measures and the reconciliation of these non-GAAP financial measures to their most
directly comparable GAAP financial measure. In the following tables, we reconcile our non-GAAP financial
measures to our reported GAAP financial results.
Although we believe the non-GAAP financial measures enhance an investor’s understanding of our
performance, our management does not itself, nor does it suggest that investors should, consider such non-GAAP
financial measures in isolation from, or as a substitute for, financial information prepared in accordance with
GAAP. The non-GAAP financial measures we use may not be consistent with the presentation of similar
companies in our industry. However, we present such non-GAAP financial measures in reporting our financial
results to provide investors with an additional tool to evaluate our operating results in a manner that focuses on
what we believe to be our ongoing business operations.
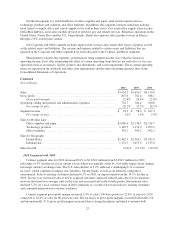
NON-GAAP RECONCILIATION FOR 2010
Operating
income
Net income
available to
OfficeMax
common
shareholders
Diluted
income
per
common
share
(millions, except per-share amounts)
As reported ................................................ $ 146.5 $ 68.6 $ 0.79
Store asset impairment charge ................................. 11.0 6.7 0.08
Store closure charges and severance adjustments ................... 12.5 7.8 0.09
Reserve adjustments related to legacy facility ..................... (9.4) (5.8) (0.07)
As adjusted ................................................ $ 160.6 $ 77.3 $ 0.89
NON-GAAP RECONCILIATION FOR 2009
Operating
income
(loss)
Net income
(loss)
available to
OfficeMax
common
shareholders
Diluted
income
(loss)
per
common
share
(millions, except per-share amounts)
As reported ................................................ $ (4.0) $ (2.2) $ (0.03)
Store asset impairment charge ................................. 17.6 10.0 0.12
Store closure and severance charges ............................. 49.3 30.0 0.39
Interest income from a legacy tax escrow ......................... — (2.7) (0.04)
Boise Cascade Holdings, L.L.C. distribution ...................... — (1.6) (0.02)
Release of income tax uncertainty reserve ........................ — (14.9) (0.18)
As adjusted ................................................ $ 62.9 $ 18.6 $ 0.24
17