OfficeMax 2010 Annual Report Download - page 93
Download and view the complete annual report
Please find page 93 of the 2010 OfficeMax annual report below. You can navigate through the pages in the report by either clicking on the pages listed below, or by using the keyword search tool below to find specific information within the annual report.-
 1
1 -
2
-
3
-
4
-
5
-
6
-
7
-
8
-
9
-
10
-
11
-
12
-
13
-
14
-
15
-
16
-
17
-
18
-
19
-
20
-
21
-
22
-
23
-
24
-
25
-
26
-
27
-
28
-
29
-
30
-
31
-
32
-
33
-
34
-
35
-
36
-
37
-
38
-
39
-
40
-
41
-
42
-
43
-
44
-
45
-
46
-
47
-
48
-
49
-
50
-
51
-
52
-
53
-
54
-
55
-
56
-
57
-
58
-
59
-
60
-
61
-
62
-
63
-
64
-
65
-
66
-
67
-
68
-
69
-
70
-
71
-
72
-
73
-
74
-
75
-
76
-
77
-
78
-
79
-
80
-
81
-
82
-
 83
83 -
 84
84 -
 85
85 -
 86
86 -
 87
87 -
 88
88 -
 89
89 -
 90
90 -
 91
91 -
 92
92 -
 93
93 -
 94
94 -
 95
95 -
 96
96 -
 97
97 -
 98
98 -
 99
99 -
 100
100 -
 101
101 -
 102
102 -
 103
103 -
104
-
105
-
106
-
107
-
108
-
109
-
110
-
111
-
112
-
113
-
114
-
115
-
116
-
117
-
118
-
119
-
120
 |
 |

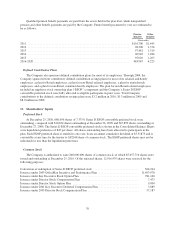
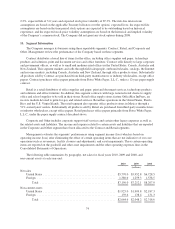
allocated to the accounts of these executive officers at December 25, 2010 and December 26, 2009, respectively.
As a result of an amendment to the plan, no additional deferrals can be allocated to the stock unit accounts.
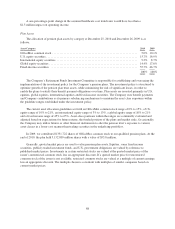
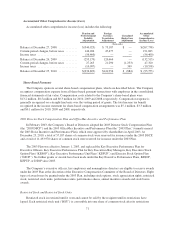
Stock Options
The Company’s stock options generally are issued at a price equal to fair market value on the grant date and
typically expire within seven years of the grant date. Stock options granted under the OfficeMax Incentive and
Performance Plan generally vest over a three year period. In 2010, 2009 and 2008, the Company recognized
$5.2 million, $2.4 million and $0.2 million, respectively, of pre-tax compensation expense and additional paid-in
capital related to stock options. The remaining compensation expense to be recognized related to outstanding
stock options, net of estimated forfeitures, is approximately $12.4 million.
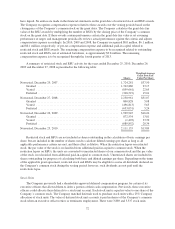
A summary of stock option activity for the years ended December 25, 2010, December 26, 2009 and
December 27, 2008 is presented in the following table:
2010 2009 2008
Shares
Wtd. Avg.
Ex. Price Shares
Wtd. Avg.
Ex. Price Shares
Wtd. Avg.
Ex. Price
Balance at beginning of year ........ 3,249,773 $15.14 1,495,795 $31.95 1,596,295 $31.84
Options granted .................. 2,060,246 16.24 2,071,360 4.77 — —
Options exercised ................ (408,519) 4.80 — — — —
Options forfeited and expired ....... (588,210) 16.02 (317,382) 26.70 (100,500) 30.08
Balance at end of year ............. 4,313,290 $16.52 3,249,773 $15.14 1,495,795 $31.95
Exercisable at end of year .......... 1,301,257 1,225,646 1,400,462
Weighted average fair value of options
granted (Black-Scholes) ......... $ 8.08 $ 2.63 $ —
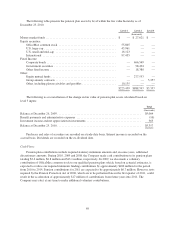
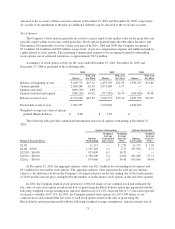
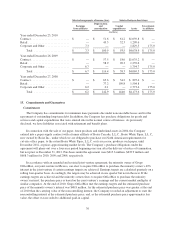
The following table provides summarized information about stock options outstanding at December 25,
2010:
Options Outstanding Options Exercisable
Range of Exercise Prices
Options
Outstanding
Weighted
Average
Contractual
Life (Years)
Weighted
Average
Exercise
Price
Options
Exercisable
Weighted
Average
Exercise
Price
$2.50 ..................................... 11,171 — $ 2.50 11,171 $ 2.50
$4.00 – $5.00 ............................... 1,355,269 5.1 4.75 233,926 4.71
$12.00 – $16.00 ............................. 915,690 6.1 14.52 — —
$18.00 – $28.00 ............................. 1,356,200 5.4 20.84 381,200 27.71
$28.01 – $39.00 ............................. 674,960 2.0 34.44 674,960 34.44
At December 25, 2010, the aggregate intrinsic value was $21.3 million for outstanding stock options and
$3.3 million for exercisable stock options. The aggregate intrinsic value represents the total pre-tax intrinsic
value (i.e. the difference between the Company’s closing stock price on the last trading day of the fourth quarter
of 2010 and the exercise price, multiplied by the number of in-the-money stock options at the end of the quarter).
In 2010, the Company granted stock options for 2,060,246 shares of our common stock and estimated the
fair value of each stock option award on the date of grant using the Black-Scholes option pricing model with the
following weighted average assumptions: risk-free interest rate of 2.12%, expected life of 3.7 years and expected
stock price volatility of 67.21%. In 2009, the Company granted stock options for 2,071,360 shares of our
common stock and estimated the fair value of each stock option award on the date of grant using the
Black-Scholes option pricing model with the following weighted average assumptions: risk-free interest rate of
73