OfficeMax 2010 Annual Report Download - page 62
Download and view the complete annual report
Please find page 62 of the 2010 OfficeMax annual report below. You can navigate through the pages in the report by either clicking on the pages listed below, or by using the keyword search tool below to find specific information within the annual report.-
 1
1 -
2
-
3
-
4
-
5
-
6
-
7
-
8
-
9
-
10
-
11
-
12
-
13
-
14
-
15
-
16
-
17
-
18
-
19
-
20
-
21
-
22
-
23
-
24
-
25
-
26
-
27
-
28
-
29
-
30
-
31
-
32
-
33
-
34
-
35
-
36
-
37
-
38
-
39
-
40
-
41
-
42
-
43
-
44
-
45
-
46
-
47
-
48
-
49
-
50
-
51
-
 52
52 -
 53
53 -
 54
54 -
 55
55 -
 56
56 -
 57
57 -
 58
58 -
 59
59 -
 60
60 -
 61
61 -
 62
62 -
 63
63 -
 64
64 -
 65
65 -
 66
66 -
 67
67 -
 68
68 -
 69
69 -
 70
70 -
 71
71 -
 72
72 -
73
-
74
-
75
-
76
-
77
-
78
-
79
-
80
-
81
-
82
-
83
-
84
-
85
-
86
-
87
-
88
-
89
-
90
-
91
-
92
-
93
-
94
-
95
-
96
-
97
-
98
-
99
-
100
-
101
-
102
-
103
-
104
-
105
-
106
-
107
-
108
-
109
-
110
-
111
-
112
-
113
-
114
-
115
-
116
-
117
-
118
-
119
-
120
 |
 |

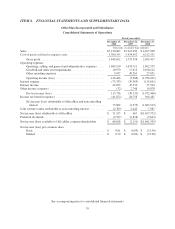
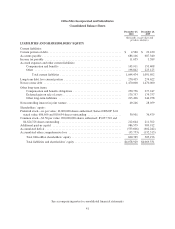
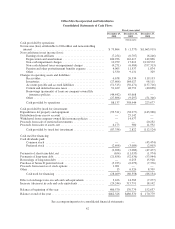
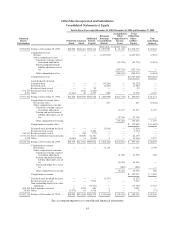
OfficeMax Incorporated and Subsidiaries
Consolidated Statements of Cash Flows
Fiscal year ended
December 25,
2010
December 26,
2009
December 27,
2008
(thousands)
Cash provided by operations:
Net income (loss) attributable to OfficeMax and noncontrolling
interest ................................................ $ 73,864 $ (1,575) $(1,665,919)
Non-cash items in net income (loss):
Earnings from affiliates ................................. (7,254) (6,707) (6,246)
Depreciation and amortization ............................ 100,936 116,417 142,896
Non-cash impairment charges ............................ 10,979 17,612 2,120,572
Non-cash deferred taxes on impairment charges .............. (4,271) (6,484) (357,313)
Pension and other postretirement benefits expense ............ 4,965 11,537 1,874
Other ................................................ 2,530 9,131 329
Changes in operating assets and liabilities:
Receivables ........................................... 6,678 26,334 119,133
Inventories ........................................... (27,606) 164,027 98,111
Accounts payable and accrued liabilities .................... (51,515) (56,471) (137,716)
Current and deferred income taxes ......................... 51,169 48,752 (40,698)
Borrowings (payments) of loans on company-owned life
insurance policies .................................... (44,442) 45,668 —
Other ................................................ (27,896) (9,297) (51,346)
Cash provided by operations ............................. 88,137 358,944 223,677
Cash provided by (used for) investment:
Expenditures for property and equipment ....................... (93,511) (38,277) (143,968)
Distribution from escrow account ............................. — 25,142 —
Withdrawal from company-owned life insurance policies ........... — 14,977 —
Proceeds from sale of restricted investments ..................... — — 20,252
Proceeds from sales of assets, net .............................. 6,173 980 11,592
Cash provided by (used for) investment ..................... (87,338) 2,822 (112,124)
Cash used for financing:
Cash dividends paid:
Common stock ........................................ — — (45,474)
Preferred stock ........................................ (2,698) (3,089) (2,003)
(2,698) (3,089) (47,477)
Payments of short-term debt, net .............................. (654) (11,035) (1,974)
Payments of long-term debt .................................. (21,858) (52,936) (53,944)
Borrowings of long-term debt ................................ — 6,255 15,928
Purchase of Series D preferred stock ........................... (5,233) (6,079) (7,376)
Proceeds from exercise of stock options ........................ 1,961 — —
Other .................................................... 13 6,326 8,709
Cash used for financing ................................. (28,469) (60,558) (86,134)
Effect of exchange rates on cash and cash equivalents ............. 3,426 14,583 (7,277)
Increase (decrease) in cash and cash equivalents .................. (24,244) 315,791 18,142
Balance at beginning of the year .............................. 486,570 170,779 152,637
Balance at end of the year .................................... $462,326 $486,570 $ 170,779
See accompanying notes to consolidated financial statements
42