OfficeMax 2010 Annual Report Download - page 88
Download and view the complete annual report
Please find page 88 of the 2010 OfficeMax annual report below. You can navigate through the pages in the report by either clicking on the pages listed below, or by using the keyword search tool below to find specific information within the annual report.-
 1
1 -
2
-
3
-
4
-
5
-
6
-
7
-
8
-
9
-
10
-
11
-
12
-
13
-
14
-
15
-
16
-
17
-
18
-
19
-
20
-
21
-
22
-
23
-
24
-
25
-
26
-
27
-
28
-
29
-
30
-
31
-
32
-
33
-
34
-
35
-
36
-
37
-
38
-
39
-
40
-
41
-
42
-
43
-
44
-
45
-
46
-
47
-
48
-
49
-
50
-
51
-
52
-
53
-
54
-
55
-
56
-
57
-
58
-
59
-
60
-
61
-
62
-
63
-
64
-
65
-
66
-
67
-
68
-
69
-
70
-
71
-
72
-
73
-
74
-
75
-
76
-
77
-
 78
78 -
 79
79 -
 80
80 -
 81
81 -
 82
82 -
 83
83 -
 84
84 -
 85
85 -
 86
86 -
 87
87 -
 88
88 -
 89
89 -
 90
90 -
 91
91 -
 92
92 -
 93
93 -
 94
94 -
 95
95 -
 96
96 -
 97
97 -
 98
98 -
99
-
100
-
101
-
102
-
103
-
104
-
105
-
106
-
107
-
108
-
109
-
110
-
111
-
112
-
113
-
114
-
115
-
116
-
117
-
118
-
119
-
120
 |
 |

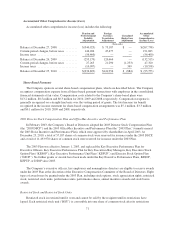
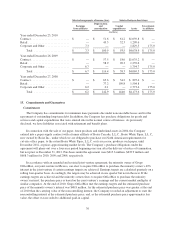
A one-percentage-point change in the assumed healthcare cost trend rates would have less than a
$1.5 million impact on operating income.
Plan Assets
The allocation of pension plan assets by category at December 25, 2010 and December 26, 2009 is as
follows:
Asset Category 2010 2009
OfficeMax common stock .......................................................... 5.0% 10.1%
U.S. equity securities .............................................................. 15.7% 16.9%
International equity securities ....................................................... 9.2% 8.7%
Global equity securities ............................................................ 14.4% 17.6%
Fixed-income securities ........................................................... 55.7% 46.7%
100% 100%
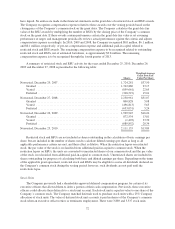
The Company’s Retirement Funds Investment Committee is responsible for establishing and overseeing the
implementation of the investment policy for the Company’s pension plans. The investment policy is structured to
optimize growth of the pension plan trust assets, while minimizing the risk of significant losses, in order to
enable the plans to satisfy their benefit payment obligations over time. Plan assets are invested primarily in U.S.
equities, global equities, international equities and fixed-income securities. The Company uses benefit payments
and Company contributions as its primary rebalancing mechanisms to maintain the asset class exposures within
the guideline ranges established under the investment policy.
The current asset allocation guidelines set forth an OfficeMax common stock range of 0% to 15%, a U.S.
equity range of 10% to 21%, an international equity range of 3% to 13%, a global equity range of 10% to 21%
and a fixed-income range of 45% to 65%. Asset-class positions within the ranges are continually evaluated and
adjusted based on expectations for future returns, the funded position of the plans and market risks. Occasionally,
the Company may utilize futures or other financial instruments to alter the pension trust’s exposure to various
asset classes in a lower-cost manner than trading securities in the underlying portfolios.
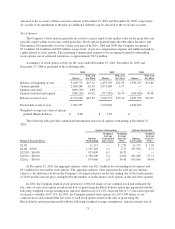
In 2009, we contributed 8,331,722 shares of OfficeMax common stock to our qualified pension plans. At the
end of 2010, the plan held 3,152,809 million shares with a value of $55.8 million.
Generally, quoted market prices are used to value pension plan assets. Equities, some fixed income
securities, publicly traded investment funds, and U.S. government obligations are valued by reference to
published market prices. Investments in certain restricted stocks are valued at the quoted market price of the
issuer’s unrestricted common stock less an appropriate discount. If a quoted market price for unrestricted
common stock of the issuer is not available, restricted common stocks are valued at a multiple of current earnings
less an appropriate discount. The multiple chosen is consistent with multiples of similar companies based on
current market prices.
68