OfficeMax 2010 Annual Report Download - page 95
Download and view the complete annual report
Please find page 95 of the 2010 OfficeMax annual report below. You can navigate through the pages in the report by either clicking on the pages listed below, or by using the keyword search tool below to find specific information within the annual report.-
 1
1 -
2
-
3
-
4
-
5
-
6
-
7
-
8
-
9
-
10
-
11
-
12
-
13
-
14
-
15
-
16
-
17
-
18
-
19
-
20
-
21
-
22
-
23
-
24
-
25
-
26
-
27
-
28
-
29
-
30
-
31
-
32
-
33
-
34
-
35
-
36
-
37
-
38
-
39
-
40
-
41
-
42
-
43
-
44
-
45
-
46
-
47
-
48
-
49
-
50
-
51
-
52
-
53
-
54
-
55
-
56
-
57
-
58
-
59
-
60
-
61
-
62
-
63
-
64
-
65
-
66
-
67
-
68
-
69
-
70
-
71
-
72
-
73
-
74
-
75
-
76
-
77
-
78
-
79
-
80
-
81
-
82
-
83
-
84
-
 85
85 -
 86
86 -
 87
87 -
 88
88 -
 89
89 -
 90
90 -
 91
91 -
 92
92 -
 93
93 -
 94
94 -
 95
95 -
 96
96 -
 97
97 -
 98
98 -
 99
99 -
 100
100 -
 101
101 -
 102
102 -
 103
103 -
 104
104 -
 105
105 -
106
-
107
-
108
-
109
-
110
-
111
-
112
-
113
-
114
-
115
-
116
-
117
-
118
-
119
-
120
 |
 |

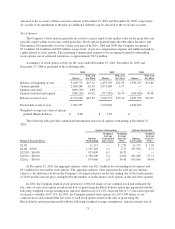
There is no single customer that accounts for 10% or more of consolidated trade sales.
Segment sales to external customers by product line are as follows:
2010 2009 2008
(millions)
Contract
Office supplies and paper ....................................... $2,086.6 $2,138.5 $2,518.7
Technology products ........................................... 1,185.5 1,174.0 1,299.2
Office furniture ............................................... 362.1 344.2 492.1
Total ................................................... $3,634.2 $3,656.7 $4,310.0
Retail
Office supplies and paper ....................................... $1,469.2 $1,446.9 $1,551.7
Technology products ........................................... 1,837.8 1,872.6 2,052.6
Office furniture ............................................... 208.8 235.9 352.7
Total ................................................... $3,515.8 $3,555.4 $3,957.0
Total OfficeMax
Office supplies and paper ....................................... $3,555.8 $3,585.4 $4,070.4
Technology products ........................................... 3,023.3 3,046.6 3,351.8
Office furniture ............................................... 570.9 580.1 844.8
Total ................................................... $7,150.0 $7,212.1 $8,267.0
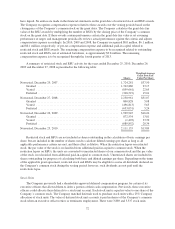
The following tables contain details of the Company’s operations by segment:
Sales
Segment
income
Goodwill and
other asset
impairments
Other
operating,
net
Operating
income
Interest
and other,
net
Income (loss)
before income
taxes
(millions)
Year ended December 25, 2010
Contract ...................... $3,634.2 $ 94.3 $ — $ — $ 94.3
Retail ........................ 3,515.8 103.9 (11.0) (12.5) 80.4
Corporate and Other ............. — (37.6) — 9.4 (28.2)
Total ..................... $7,150.0 $160.6 $ (11.0) $ (3.1) $ 146.5 $(30.8) $ 115.7
Year ended December 26, 2009
Contract ...................... $3,656.7 $ 58.0 $ — $(15.3) $ 42.7
Retail ........................ 3,555.4 44.9 (17.6) (33.3) (6.0)
Corporate and Other ............. — (40.0) — (0.7) (40.7)
Total ..................... $7,212.1 $ 62.9 $ (17.6) $(49.3) $ (4.0) $(26.3) $ (30.3)
Year ended December 27, 2008
Contract ...................... $4,310.0 $167.3 $ (815.5) $ (9.3) $ (657.5)
Retail ........................ 3,957.0 61.2 (548.9) (17.4) (505.1)
Corporate and Other ............. — (36.6) (735.8) (1.2) (773.6)
Total ..................... $8,267.0 $191.9 $(2,100.2) $(27.9) $(1,936.2) $(36.2) $(1,972.4)
75