OfficeMax 2010 Annual Report Download - page 45
Download and view the complete annual report
Please find page 45 of the 2010 OfficeMax annual report below. You can navigate through the pages in the report by either clicking on the pages listed below, or by using the keyword search tool below to find specific information within the annual report.-
 1
1 -
2
-
3
-
4
-
5
-
6
-
7
-
8
-
9
-
10
-
11
-
12
-
13
-
14
-
15
-
16
-
17
-
18
-
19
-
20
-
21
-
22
-
23
-
24
-
25
-
26
-
27
-
28
-
29
-
30
-
31
-
32
-
33
-
34
-
 35
35 -
 36
36 -
 37
37 -
 38
38 -
 39
39 -
 40
40 -
 41
41 -
 42
42 -
 43
43 -
 44
44 -
 45
45 -
 46
46 -
 47
47 -
 48
48 -
 49
49 -
 50
50 -
 51
51 -
 52
52 -
 53
53 -
 54
54 -
 55
55 -
56
-
57
-
58
-
59
-
60
-
61
-
62
-
63
-
64
-
65
-
66
-
67
-
68
-
69
-
70
-
71
-
72
-
73
-
74
-
75
-
76
-
77
-
78
-
79
-
80
-
81
-
82
-
83
-
84
-
85
-
86
-
87
-
88
-
89
-
90
-
91
-
92
-
93
-
94
-
95
-
96
-
97
-
98
-
99
-
100
-
101
-
102
-
103
-
104
-
105
-
106
-
107
-
108
-
109
-
110
-
111
-
112
-
113
-
114
-
115
-
116
-
117
-
118
-
119
-
120
 |
 |
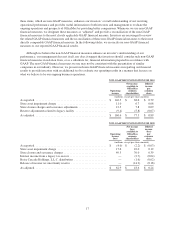
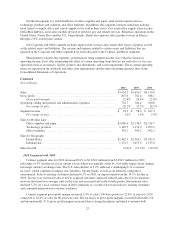
Retail segment income was $103.9 million, or 3.0% of sales, for 2010, compared to $44.9 million, or 1.3%
of sales, for 2009. The increase in segment income was primarily attributable to the improved gross profit
margins as noted above and significant improvement in our Mexican joint venture’s earnings, which was
partially offset by the increased costs from our long-term growth initiatives.
2009 Compared with 2008
Retail segment sales for 2009 decreased by 10.2% (9.1% on a local currency basis) to $3,555.4 million from
$3,957.0 million for 2008, reflecting a same-store sales decrease of 11.0% mitigated by new store improvement.
This included a same-store sales decline in the U.S. of 9.6% and in Mexico of 13.9% on a local currency basis.
Retail same-store sales declined primarily due to weaker consumer and small business spending in the U.S. and
the significant negative effects of weak economic conditions in Mexico together with the effects of the influenza
epidemic during the summer. Store traffic was lower compared to the prior year as sales declined across all major
product categories, particularly in the higher-priced, discretionary furniture category, which resulted in decreased
average tickets. We ended 2009 with 1,010 stores. In the U.S., we opened 12 retail stores and closed 18, ending
the year with 933 retail stores. Grupo OfficeMax, our majority-owned joint venture in Mexico, closed six stores,
ending the year with 77 retail stores.
Retail segment gross profit margin declined 0.6% of sales (60 basis points) to 27.4% of sales for 2009,
compared to 28.0% of sales in the previous year. The declines were primarily due to the deleveraging of fixed
occupancy costs which has continued since late-2007, offset by favorable product margins, which benefited from
good vendor support and lower inventory shrinkage, reduced delivery costs, and strong cost controls over utilities
and maintenance. Margins were also negatively impacted by a shift to lower margin technology products.
Retail segment operating, selling and general and administrative expenses decreased 0.4% of sales to 26.1%
of sales for 2009 from 26.5% of sales a year earlier. The decrease was primarily due to targeted cost reductions in
response to the sales shortfall partially offset by $29.4 million in additional incentive compensation expenses in
2009 and the deleveraging effect of reduced sales. Results in the Retail segment benefited from a favorable
property tax settlement of approximately $5 million as well as the resolution of a prior dispute with a service
provider, the effects of which were partially offset by adverse workers compensation expense related to prior
period claims. Cost reductions consisted primarily of reduced payroll costs resulting from reductions in staff in
the stores, in field management and at the corporate headquarters and lower advertising and pre-opening costs.
Retail segment income was $44.9 million, or 1.3% of sales, for 2009, compared to $61.2 million, or 1.5% of
sales, for 2008. The decline in segment income was primarily attributable to the reduction in sales and gross
profit, partially offset by the effects of cost reduction initiatives.
Corporate and Other
Corporate and Other expenses were $28.2 million for 2010 compared to $40.7 million for 2009. Expenses
recorded in 2010 included $9.4 million of income associated with our legacy building materials manufacturing
facility near Elma, Washington as well as pension expenses that were lower than in 2009.
Expenses recorded in 2009 included a $0.7 million pre-tax charge for severance. Compared to 2008, 2009
expenses included increased incentive compensation expense ($3.8 million more) and higher pension costs which
more than offset reduced payroll expense resulting from reductions in staff at the corporate headquarters in late
2008. Expenses recorded in 2008 totaled $773.6 million and included a $735.8 million charge related to the
impairment of the timber installment note guaranteed by Lehman, a $4.3 million severance charge related to a
fourth quarter reduction in force at our corporate headquarters and a $3.1 million gain, primarily related to the
release of a warranty escrow established at the time of sale of our legacy Voyageur Panel business in 2004.
25