OfficeMax 2010 Annual Report Download - page 42
Download and view the complete annual report
Please find page 42 of the 2010 OfficeMax annual report below. You can navigate through the pages in the report by either clicking on the pages listed below, or by using the keyword search tool below to find specific information within the annual report.-
 1
1 -
2
-
3
-
4
-
5
-
6
-
7
-
8
-
9
-
10
-
11
-
12
-
13
-
14
-
15
-
16
-
17
-
18
-
19
-
20
-
21
-
22
-
23
-
24
-
25
-
26
-
27
-
28
-
29
-
30
-
31
-
 32
32 -
 33
33 -
 34
34 -
 35
35 -
 36
36 -
 37
37 -
 38
38 -
 39
39 -
 40
40 -
 41
41 -
 42
42 -
 43
43 -
 44
44 -
 45
45 -
 46
46 -
 47
47 -
 48
48 -
 49
49 -
 50
50 -
 51
51 -
 52
52 -
53
-
54
-
55
-
56
-
57
-
58
-
59
-
60
-
61
-
62
-
63
-
64
-
65
-
66
-
67
-
68
-
69
-
70
-
71
-
72
-
73
-
74
-
75
-
76
-
77
-
78
-
79
-
80
-
81
-
82
-
83
-
84
-
85
-
86
-
87
-
88
-
89
-
90
-
91
-
92
-
93
-
94
-
95
-
96
-
97
-
98
-
99
-
100
-
101
-
102
-
103
-
104
-
105
-
106
-
107
-
108
-
109
-
110
-
111
-
112
-
113
-
114
-
115
-
116
-
117
-
118
-
119
-
120
 |
 |

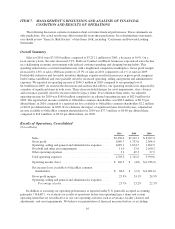
Our Retail segment is a retail distributor of office supplies and paper, print and document services,
technology products and solutions and office furniture. In addition, this segment contracts with large national
retail chains to supply office and school supplies to be sold in their stores. Our retail office supply stores feature
OfficeMax ImPress, an in-store module devoted to print-for-pay and related services. Retail has operations in the
United States, Puerto Rico and the U.S. Virgin Islands. Retail also operates office products stores in Mexico
through a 51%-owned joint venture.
Our Corporate and Other segment includes support staff services and certain other legacy expenses as well
as the related assets and liabilities. The income and expense related to certain assets and liabilities that are
reported in the Corporate and Other segment have been allocated to the Contract and Retail segments.
Management evaluates the segments’ performances using segment income (loss) which is based on
operating income (loss) after eliminating the effect of certain operating items that are not indicative of our core
operations such as severances, facility closures and adjustments, and asset impairments. These certain operating
items are reported on the goodwill and other asset impairments and the other operating expenses lines in the
Consolidated Statements of Operations.
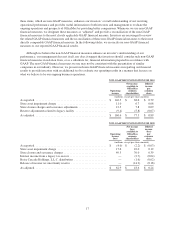
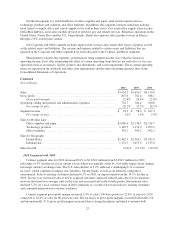
Contract
($ in millions)
2010 2009 2008
Sales ........................................................... $3,634.2 $3,656.7 $4,310.0
Gross profit ...................................................... 827.0 762.4 948.1
Gross profit margin ............................................ 22.8% 20.8% 22.0%
Operating, selling and general and administrative expenses ................ 732.7 704.4 780.8
Percentage of sales ............................................ 20.2% 19.2% 18.1%
Segment income $ 94.3 $ 58.0 $ 167.3
Percentage of sales ............................................ 2.6% 1.6% 3.9%
Sales by Product Line
Office supplies and paper ....................................... $2,086.6 $2,138.5 $2,518.7
Technology products ........................................... 1,185.5 1,174.0 1,299.2
Office furniture ............................................... 362.1 344.2 492.1
Sales by Geography
United States ................................................. $2,482.5 $2,583.1 $3,035.0
International ................................................. 1,151.7 1,073.6 1,275.0
Sales Growth .................................................... (0.6)% (15.2)% (10.5)%
2010 Compared with 2009
Contract segment sales for 2010 decreased 0.6% to $3,634.2 million from $3,656.7 million for 2009,
reflecting a 4.3% decline on a local currency basis which was partially offset by a favorable impact from changes
in foreign currency exchange rates. The U.S. sales decline of 3.9% reflected a challenging U.S. economic
recovery, which continues to impact our customers’ buying trends, as well as an intensely competitive
environment. Sales to existing customers declined 6.2% in 2010, an improvement from the 14.7% decline in
2009. For the year, increased sales to newly acquired customers outpaced reduced sales due to lost customers,
however that trend was stronger early in the year and reversed itself in the fourth quarter. International sales
declined 5.2% on a local currency basis in 2010, primarily as a result of decreased sales to existing customers
and continued international economic weakness.
Contract segment gross profit margin increased 2.0% of sales (200 basis points) to 22.8% of sales for 2010
compared to 20.8% of sales for the previous year. The increases in gross profit margins occurred both in the U.S.
and internationally. U.S. gross profit margins increased due to strong disciplines instituted to monitor both
22