OfficeMax 2010 Annual Report Download - page 85
Download and view the complete annual report
Please find page 85 of the 2010 OfficeMax annual report below. You can navigate through the pages in the report by either clicking on the pages listed below, or by using the keyword search tool below to find specific information within the annual report.-
 1
1 -
2
-
3
-
4
-
5
-
6
-
7
-
8
-
9
-
10
-
11
-
12
-
13
-
14
-
15
-
16
-
17
-
18
-
19
-
20
-
21
-
22
-
23
-
24
-
25
-
26
-
27
-
28
-
29
-
30
-
31
-
32
-
33
-
34
-
35
-
36
-
37
-
38
-
39
-
40
-
41
-
42
-
43
-
44
-
45
-
46
-
47
-
48
-
49
-
50
-
51
-
52
-
53
-
54
-
55
-
56
-
57
-
58
-
59
-
60
-
61
-
62
-
63
-
64
-
65
-
66
-
67
-
68
-
69
-
70
-
71
-
72
-
73
-
74
-
 75
75 -
 76
76 -
 77
77 -
 78
78 -
 79
79 -
 80
80 -
 81
81 -
 82
82 -
 83
83 -
 84
84 -
 85
85 -
 86
86 -
 87
87 -
 88
88 -
 89
89 -
 90
90 -
 91
91 -
 92
92 -
 93
93 -
 94
94 -
 95
95 -
96
-
97
-
98
-
99
-
100
-
101
-
102
-
103
-
104
-
105
-
106
-
107
-
108
-
109
-
110
-
111
-
112
-
113
-
114
-
115
-
116
-
117
-
118
-
119
-
120
 |
 |

Obligations and Funded Status
The changes in pension and other postretirement benefit obligations and plan assets during 2010 and 2009,
as well as the funded status of the Company’s plans at December 25, 2010 and December 26, 2009 were as
follows:
Pension Benefits Other Benefits
2010 2009 2010 2009
(thousands)
Change in benefit obligation:
Benefit obligation at beginning of year ................... $1,260,676 $1,276,209 $ 20,337 $ 17,582
Service cost ......................................... 3,164 4,506 263 184
Interest cost ......................................... 74,213 75,858 1,213 1,137
Actuarial loss ....................................... 59,494 5,721 2,634 1,432
Changes due to exchange rates .......................... — — 792 1,885
Benefits paid ........................................ (99,892) (101,618) (1,218) (1,883)
Benefit obligation at end of year ........................ $1,297,655 $1,260,676 $ 24,021 $ 20,337
Change in plan assets:
Fair value of plan assets at beginning of year .............. $1,050,514 $ 841,204 $ — $ —
Actual return on plan assets ............................ 163,342 222,022 — —
Employer contributions ............................... 3,449 88,906 1,218 1,883
Benefits paid ........................................ (99,892) (101,618) (1,218) (1,883)
Fair value of plan assets at end of year .................... $1,117,413 $1,050,514 $ — $ —
Funded status ....................................... $ (180,242) $ (210,162) $(24,021) $(20,337)
The following table shows the amounts recognized in the Consolidated Balance Sheets related to the
Company’s defined benefit pension and other postretirement benefit plans at year-end:
Pension Benefits Other Benefits
2010 2009 2010 2009
(thousands)
Noncurrent assets ...................................... $ 4,581 $ 2,355 $ — $ —
Current liabilities ...................................... (6,683) (3,773) (1,445) (1,526)
Noncurrent liabilities ................................... (178,140) (208,744) (22,576) (18,811)
Net amount recognized ................................. $(180,242) $(210,162) $(24,021) $(20,337)
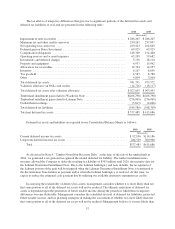
Amounts recognized in accumulated other comprehensive income consist of:
Net loss ............................................... $406,465 $440,206 $ 6,054 $ 3,520
Prior service cost (credit) ................................. — — (26,147) (30,148)
Total ................................................. $406,465 $440,206 $(20,093) $(26,628)
The accumulated benefit obligation for all defined benefit pension plans was $1,297.7 million and $1,260.5
million for December 25, 2010 and December 26, 2009, respectively.
65