OfficeMax 2010 Annual Report Download - page 43
Download and view the complete annual report
Please find page 43 of the 2010 OfficeMax annual report below. You can navigate through the pages in the report by either clicking on the pages listed below, or by using the keyword search tool below to find specific information within the annual report.-
 1
1 -
2
-
3
-
4
-
5
-
6
-
7
-
8
-
9
-
10
-
11
-
12
-
13
-
14
-
15
-
16
-
17
-
18
-
19
-
20
-
21
-
22
-
23
-
24
-
25
-
26
-
27
-
28
-
29
-
30
-
31
-
32
-
 33
33 -
 34
34 -
 35
35 -
 36
36 -
 37
37 -
 38
38 -
 39
39 -
 40
40 -
 41
41 -
 42
42 -
 43
43 -
 44
44 -
 45
45 -
 46
46 -
 47
47 -
 48
48 -
 49
49 -
 50
50 -
 51
51 -
 52
52 -
 53
53 -
54
-
55
-
56
-
57
-
58
-
59
-
60
-
61
-
62
-
63
-
64
-
65
-
66
-
67
-
68
-
69
-
70
-
71
-
72
-
73
-
74
-
75
-
76
-
77
-
78
-
79
-
80
-
81
-
82
-
83
-
84
-
85
-
86
-
87
-
88
-
89
-
90
-
91
-
92
-
93
-
94
-
95
-
96
-
97
-
98
-
99
-
100
-
101
-
102
-
103
-
104
-
105
-
106
-
107
-
108
-
109
-
110
-
111
-
112
-
113
-
114
-
115
-
116
-
117
-
118
-
119
-
120
 |
 |
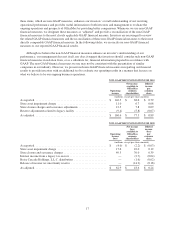
customer profitability and product costs as well as reduced delivery costs. The current year also benefited from
the reversal of inventory shrinkage reserves due to favorable results from our annual physical inventory counts of
$3.5 million. International margin improvements resulted from improved product margins resulting from a strong
back-to-school season in Australia, favorable foreign exchange rate impact on Canadian paper purchases and
profitability initiatives related to our own private label products.
Contract segment operating, selling and general and administrative expenses increased 1.0% of sales to
20.2% for 2010 from 19.2% of sales a year earlier. The increase was primarily due to costs associated with
growth and profitability initiatives associated with our managed-print-services, customer service centers and
business-to-business website, partially offset by favorable trends in workers compensation and medical benefit
expenses as well as lower payroll costs from the reorganization of our U.S. sales force and U.S. customer service
operations.
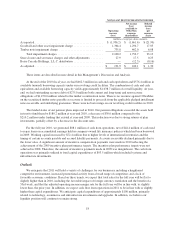
Contract segment income was $94.3 million, or 2.6% of sales, for 2010, compared to $58.0 million, or 1.6%
of sales, for 2009. The increase in segment income was primarily attributable to the increased gross profit margin
partially offset by higher operating, selling and general and administrative expenses due primarily to increased
spending on our growth and profitability initiatives.
2009 Compared with 2008
Contract segment sales for 2009 decreased 15.2% to $3,656.7 million from $4,310.0 million for 2008,
reflecting a U.S. sales decline of 14.9% and an international sales decline of 15.8% in U.S. dollars, or 8.2% on a
local currency basis. Total Contract sales declined 12.9% on a local currency basis. The U.S. Contract sales
decline primarily reflected weaker sales from existing corporate accounts as our customers reduced overhead
spending and headcount in response to the weak overall U.S. economy. This decline continued to be meaningful,
increasing (as measured by the rate of decline compared to the prior year) in the first two quarters, while
decreasing modestly in the third and fourth quarters. For the year, the reduction in sales volume from lost
customers was greater than the incremental sales from newly acquired customers.
Contract segment gross profit margin declined 1.2% of sales (120 basis points) to 20.8% of sales for 2009
compared to 22.0% of sales in the previous year. The decrease in gross profit margin was primarily due to softer
market conditions, a shift in the purchasing trends of our customers to a higher percentage of on-contract items,
including lower-margin commodities and consumable items like paper, and higher customer acquisition and
retention expenses as a percentage of sales. Our Contract performance in the fourth quarter improved from the
previous quarters in 2009 due to our disciplined approach to profitable customer acquisition and retention, as
well as other initiatives to grow the business and improve margins by providing better solutions for our
customers. Targeted cost controls in our delivery fleet helped to mitigate the impact of deleveraging.
Contract segment operating, selling and general and administrative expenses increased 1.1% of sales to
19.2% of sales for 2009 from 18.1% of sales a year earlier. The increase was primarily due to the deleveraging of
fixed expenses from lower sales and increased incentive compensation expenses, which were $22.1 million
higher in 2009 compared to 2008, partially offset by cost management initiatives, including lower payroll costs
as a result of the reorganization of our U.S. and Canadian sales forces, fewer personnel in our customer
fulfillment and customer service centers and the reduction in force at our corporate headquarters in the fourth
quarter of 2008.
Contract segment income was $58.0 million, or 1.6% of sales, for 2009, compared to $167.3, or 3.9% of
sales, million for 2008. The decline in segment income was primarily attributable to the reduction in sales and
gross profit.
23