OfficeMax 2009 Annual Report Download - page 88
Download and view the complete annual report
Please find page 88 of the 2009 OfficeMax annual report below. You can navigate through the pages in the report by either clicking on the pages listed below, or by using the keyword search tool below to find specific information within the annual report.-
 1
1 -
2
-
3
-
4
-
5
-
6
-
7
-
8
-
9
-
10
-
11
-
12
-
13
-
14
-
15
-
16
-
17
-
18
-
19
-
20
-
21
-
22
-
23
-
24
-
25
-
26
-
27
-
28
-
29
-
30
-
31
-
32
-
33
-
34
-
35
-
36
-
37
-
38
-
39
-
40
-
41
-
42
-
43
-
44
-
45
-
46
-
47
-
48
-
49
-
50
-
51
-
52
-
53
-
54
-
55
-
56
-
57
-
58
-
59
-
60
-
61
-
62
-
63
-
64
-
65
-
66
-
67
-
68
-
69
-
70
-
71
-
72
-
73
-
74
-
75
-
76
-
77
-
 78
78 -
 79
79 -
 80
80 -
 81
81 -
 82
82 -
 83
83 -
 84
84 -
 85
85 -
 86
86 -
 87
87 -
 88
88 -
 89
89 -
 90
90 -
 91
91 -
 92
92 -
 93
93 -
 94
94 -
 95
95 -
 96
96 -
 97
97 -
 98
98 -
99
-
100
-
101
-
102
-
103
-
104
-
105
-
106
-
107
-
108
-
109
-
110
-
111
-
112
-
113
-
114
-
115
-
116
 |
 |

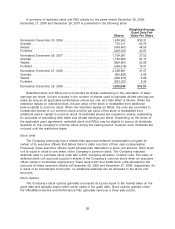
A summary of stock option activity for the years ended December 26, 2009, December 27,
2008 and December 29, 2007 is presented in the following table:
2009 2008 2007
Wtd. Avg. Wtd. Avg. Wtd. Avg.
Shares Ex. Price Shares Ex. Price Shares Ex. Price
Balance at beginning of
year ............. 1,495,795 $31.95 1,596,295 $31.84 1,753,188 $31.81
Options granted ...... 2,071,360 4.77 — — 35,000 31.39
Options exercised .... — — — — (187,843) 31.49
Options forfeited and
expired .......... (317,382) 26.70 (100,500) 30.08 (4,050) 32.88
Balance at end of year . 3,249,773 $15.14 1,495,795 $31.95 1,596,295 $31.84
Exercisable at end of
year ............. 1,225,646 1,400,462 1,409,896
Weighted average fair
value of options
granted (Black-
Scholes) .......... $ 2.63 — $ 7.95
The following table provides summarized information about stock options outstanding at
December 26, 2009:
Options Outstanding Options Exercisable
Weighted Weighted Weighted
Average Average Average
Options Contractual Exercise Options Exercise
Range of Exercise Prices Outstanding Life (Years) Price Exercisable Price
$2.50 .................. 11,171 — $ 2.50 11,171 $ 2.50
$4.00 – $5.00 ............ 1,976,460 6.1 4.77 — —
$18.00 – $28.00 .......... 534,782 0.7 27.65 534,782 27.65
$28.01 – $39.00 .......... 727,360 2.8 34.32 679,693 34.46
The remaining compensation expense to be recognized related to outstanding stock options,
net of estimated forfeitures, is approximately $2.4 million. At December 26, 2009, the aggregate
intrinsic value was $17.5 million for outstanding stock options and $0.1 million for exercisable stock
options. The aggregate intrinsic value represents the total pre-tax intrinsic value (i.e. the difference
between the Company’s closing stock price on the last trading day of the fourth quarter of 2009
and the exercise price, multiplied by the number of in-the-money stock options at the end of the
quarter).
In 2009, the Company granted stock options for 2,071,360 shares of our common stock and
estimated the fair value of each stock option award on the date of grant using the Black-Scholes
option pricing model with the following weighted-average assumptions: risk-free interest rate of
2.2% (based on the applicable Treasury bill rate); expected life of 3.0 years (based on the time
period stock options are expected to be outstanding based on historical experience); and expected
stock price volatility of 87.3% (based on the historical volatility of the Company’s common stock).
The Company did not grant any stock options during 2008. In 2007, the Company estimated the
fair value of each stock option award on the date of grant using the Black-Scholes option pricing
model with the following weighted-average assumptions: risk-free interest rate of 4.5% (based on
the applicable Treasury bill rate); expected dividends of 60 cents per share (based on actual cash
dividends expected to be paid); expected life of 3.0 years (based on the time period stock options
are expected to be outstanding based on historical experience); and expected stock price volatility
of 35.5% (based on the historical volatility of the Company’s common stock).
84