OfficeMax 2009 Annual Report Download - page 83
Download and view the complete annual report
Please find page 83 of the 2009 OfficeMax annual report below. You can navigate through the pages in the report by either clicking on the pages listed below, or by using the keyword search tool below to find specific information within the annual report.-
 1
1 -
2
-
3
-
4
-
5
-
6
-
7
-
8
-
9
-
10
-
11
-
12
-
13
-
14
-
15
-
16
-
17
-
18
-
19
-
20
-
21
-
22
-
23
-
24
-
25
-
26
-
27
-
28
-
29
-
30
-
31
-
32
-
33
-
34
-
35
-
36
-
37
-
38
-
39
-
40
-
41
-
42
-
43
-
44
-
45
-
46
-
47
-
48
-
49
-
50
-
51
-
52
-
53
-
54
-
55
-
56
-
57
-
58
-
59
-
60
-
61
-
62
-
63
-
64
-
65
-
66
-
67
-
68
-
69
-
70
-
71
-
72
-
 73
73 -
 74
74 -
 75
75 -
 76
76 -
 77
77 -
 78
78 -
 79
79 -
 80
80 -
 81
81 -
 82
82 -
 83
83 -
 84
84 -
 85
85 -
 86
86 -
 87
87 -
 88
88 -
 89
89 -
 90
90 -
 91
91 -
 92
92 -
 93
93 -
94
-
95
-
96
-
97
-
98
-
99
-
100
-
101
-
102
-
103
-
104
-
105
-
106
-
107
-
108
-
109
-
110
-
111
-
112
-
113
-
114
-
115
-
116
 |
 |

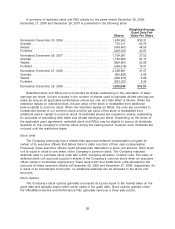
its primary rebalancing mechanisms to maintain the asset class exposures within the guideline
ranges established under the investment policy.
The current asset allocation guidelines set forth an OfficeMax common stock range of 0% to
15%, a U.S. equity range of 12% to 23%, an international equity range of 4% to 14%, a global
equity range of 12% to 23% and a fixed-income range of 37% to 57%. Asset-class positions within
the ranges are continually evaluated and adjusted based on expectations for future returns, the
funded position of the plans and market risks. Occasionally, the Company may utilize futures or
other financial instruments to alter the pension trust’s exposure to various asset classes in a
lower-cost manner than trading securities in the underlying portfolios.
In 2009, we contributed 8,331,722 shares of OfficeMax common stock to our qualified pension
plans. At the end of 2009, the plan held 8,331,722 million shares with a value of $105.7 million.
Generally, quoted market prices are used to value pension plan assets. Equities, some fixed
income securities, publicly traded investment funds, and U.S. government obligations are valued by
reference to published market prices. Investments in certain restricted stocks are valued at the
quoted market price of the issuer’s unrestricted common stock less an appropriate discount. If a
quoted market price for unrestricted common stock of the issuer is not available, restricted common
stocks are valued at a multiple of current earnings less an appropriate discount. The multiple
chosen is consistent with multiples of similar companies based on current market prices.
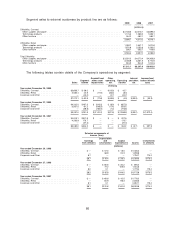
The following table presents the pension plan assets by level within the fair value hierarchy as
of December 26, 2009.
Level 1 Level 2 Level 3
(thousands)
Money market funds ................................. $ — $ 30,009 $ —
Equity securities:
OfficeMax common stock ............................ 105,730 — —
U.S. large-cap .................................... 62,385 — —
U.S. small and mid-cap ............................. 17,212 — —
International ..................................... 56,629 — —
Fixed Income:
Corporate bonds .................................. — 425,378 —
Government securities .............................. — 29,127 —
Mortgage backed securities .......................... — 3,139 —
Other fixed income ................................. — 8,362 —
Other:
Equity mutual Funds ............................... — 303,804 —
Group annuity contracts ............................. — — 5,004
Other, including plan receivables and payables ............ 3,735 — —
$245,691 $799,819 $5,004
79