OfficeMax 2009 Annual Report Download - page 30
Download and view the complete annual report
Please find page 30 of the 2009 OfficeMax annual report below. You can navigate through the pages in the report by either clicking on the pages listed below, or by using the keyword search tool below to find specific information within the annual report.-
 1
1 -
2
-
3
-
4
-
5
-
6
-
7
-
8
-
9
-
10
-
11
-
12
-
13
-
14
-
15
-
16
-
17
-
18
-
19
-
 20
20 -
 21
21 -
 22
22 -
 23
23 -
 24
24 -
 25
25 -
 26
26 -
 27
27 -
 28
28 -
 29
29 -
 30
30 -
 31
31 -
 32
32 -
 33
33 -
 34
34 -
 35
35 -
 36
36 -
 37
37 -
 38
38 -
 39
39 -
 40
40 -
41
-
42
-
43
-
44
-
45
-
46
-
47
-
48
-
49
-
50
-
51
-
52
-
53
-
54
-
55
-
56
-
57
-
58
-
59
-
60
-
61
-
62
-
63
-
64
-
65
-
66
-
67
-
68
-
69
-
70
-
71
-
72
-
73
-
74
-
75
-
76
-
77
-
78
-
79
-
80
-
81
-
82
-
83
-
84
-
85
-
86
-
87
-
88
-
89
-
90
-
91
-
92
-
93
-
94
-
95
-
96
-
97
-
98
-
99
-
100
-
101
-
102
-
103
-
104
-
105
-
106
-
107
-
108
-
109
-
110
-
111
-
112
-
113
-
114
-
115
-
116
 |
 |

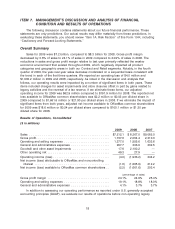
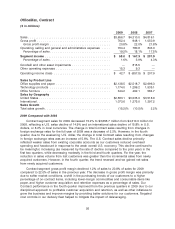
OfficeMax, Contract
($ in millions)
2009 2008 2007
Sales ............................................. $3,656.7 $4,310.0 $4,816.1
Gross profit ........................................ 762.4 948.1 1,050.9
Gross profit margin ................................. 20.8% 22.0% 21.8%
Operating, selling and general and administrative expenses ..... 704.4 780.8 843.0
Percentage of sales ................................. 19.2% 18.1% 17.5%
Segment income .................................... $ 58.0 $ 167.3 $ 207.9
Percentage of sales ................................. 1.6% 3.9% 4.3%
Goodwill and other asset impairments ..................... — 815.5 —
Other operating expenses .............................. 15.3 9.3 —
Operating income (loss) ............................... $ 42.7 $ (657.5) $ 207.9
Sales by Product Line
Office supplies and paper .............................. $2,138.5 $2,518.7 $2,696.3
Technology products ................................. 1,174.0 1,299.2 1,535.1
Office furniture ...................................... 344.2 492.1 584.7
Sales by Geography
United States ....................................... $2,583.1 $3,035.0 $3,518.9
International ........................................ 1,073.6 1,275.0 1,297.2
Sales Growth
Total sales growth .................................... (15.2)% (10.5)% 2.2%
2009 Compared with 2008
Contract segment sales for 2009 decreased 15.2% to $3,656.7 million from $4,310.0 million for
2008, reflecting a U.S. sales decline of 14.9% and an international sales decline of 15.8% in U.S.
dollars, or 8.2% in local currencies. The change in total Contract sales resulting from changes in
foreign exchange rates for the full year of 2009 was a decrease of 2.2%. However, in the fourth
quarter, due to the weakening U.S. dollar, the change in total Contract sales resulting from changes
in foreign exchange rates was an increase of 5.6%. The U.S. Contract sales decline primarily
reflected weaker sales from existing corporate accounts as our customers reduced overhead
spending and headcount in response to the weak overall U.S. economy. This decline continued to
be meaningful, increasing (as measured by the rate of decline compared to the prior year) in the
first two quarters, while decreasing modestly in the third and fourth quarters. For the year, the
reduction in sales volume from lost customers was greater than the incremental sales from newly
acquired customers. However, in the fourth quarter, the trend reversed and we gained net sales
from newly acquired customers.
Contract segment gross profit margin declined 1.2% of sales to 20.8% of sales for 2009
compared to 22.0% of sales in the previous year. The decrease in gross profit margin was primarily
due to softer market conditions, a shift in the purchasing trends of our customers to a higher
percentage of on-contract items, including lower-margin commodities and consumable items like
paper, and higher customer acquisition and retention expenses as a percentage of sales. Our
Contract performance in the fourth quarter improved from the previous quarters in 2009 due to our
disciplined approach to profitable customer acquisition and retention, as well as other initiatives to
grow the business and improve margins by providing better solutions for our customers. Targeted
cost controls in our delivery fleet helped to mitigate the impact of deleveraging.
26