OfficeMax 2009 Annual Report Download - page 33
Download and view the complete annual report
Please find page 33 of the 2009 OfficeMax annual report below. You can navigate through the pages in the report by either clicking on the pages listed below, or by using the keyword search tool below to find specific information within the annual report.-
 1
1 -
2
-
3
-
4
-
5
-
6
-
7
-
8
-
9
-
10
-
11
-
12
-
13
-
14
-
15
-
16
-
17
-
18
-
19
-
20
-
21
-
22
-
 23
23 -
 24
24 -
 25
25 -
 26
26 -
 27
27 -
 28
28 -
 29
29 -
 30
30 -
 31
31 -
 32
32 -
 33
33 -
 34
34 -
 35
35 -
 36
36 -
 37
37 -
 38
38 -
 39
39 -
 40
40 -
 41
41 -
 42
42 -
 43
43 -
44
-
45
-
46
-
47
-
48
-
49
-
50
-
51
-
52
-
53
-
54
-
55
-
56
-
57
-
58
-
59
-
60
-
61
-
62
-
63
-
64
-
65
-
66
-
67
-
68
-
69
-
70
-
71
-
72
-
73
-
74
-
75
-
76
-
77
-
78
-
79
-
80
-
81
-
82
-
83
-
84
-
85
-
86
-
87
-
88
-
89
-
90
-
91
-
92
-
93
-
94
-
95
-
96
-
97
-
98
-
99
-
100
-
101
-
102
-
103
-
104
-
105
-
106
-
107
-
108
-
109
-
110
-
111
-
112
-
113
-
114
-
115
-
116
 |
 |
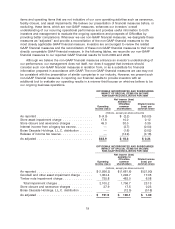
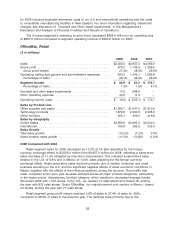
deleveraging of fixed occupancy costs which has continued since late-2007, offset by favorable
product margins, which benefited from good vendor support and lower inventory shrinkage,
reduced delivery costs, and strong cost controls over utilities and maintenance. Margins were also
negatively impacted by a shift to lower margin technology products.
Retail segment operating, selling and general and administrative expenses decreased 0.4% of
sales to 26.1% of sales for 2009 from 26.5% of sales a year earlier. The decrease was primarily due
to targeted cost reductions in response to the sales shortfall partially offset by $29.4 million in
additional incentive compensation expenses in 2009 and the deleveraging effect of reduced sales.
Results in the Retail segment benefited from a favorable property tax settlement as well as the
resolution of a prior dispute with a service provider, the effects of which were partially offset by
adverse workers compensation expense related to prior period claims. Cost reductions consist
primarily of reduced payroll costs resulting from reductions in staff in the stores, in field
management and at the corporate headquarters and lower advertising and pre-opening costs.
Retail segment income was $44.9 million, or 1.3% of sales, for 2009, compared to $61.2 million
for 2008. The decline in segment income was primarily attributable to the reduction in sales and
gross profit, partially offset by the effects of cost reduction initiatives.
For 2009, the Retail segment recorded a $17.6 million non-cash charge related to impaired
store assets. Other operating expense included charges of $33.3 million primarily related to store
closure costs. The segment closed 21 underperforming stores prior to the end of their lease terms,
of which 16 were in the U.S. and five were in Mexico with a total cost of $31.2 million. In addition,
the segment incurred $2.1 million of severance related to a streamlining of our Retail store staffing.
The Retail segment’s operating loss improved $499.1 million to an operating loss of
$6.0 million in 2009, compared to an operating loss of $505.1 million in 2008.
2008 Compared With 2007
Retail segment sales for 2008 decreased by 7.2% to $3,957.0 million from $4,265.9 million for
2007, reflecting a same-store sales decrease of 10.8%, partially offset by sales by new stores. The
weaker U.S. consumer and small business spending was evidenced by lower store traffic and
weaker back-to-school and holiday seasons than in the previous year. Retail same-store sales for
2008 declined across all major product categories, compared to the prior year. Declines were
greatest in the higher-priced, discretionary furniture and technology product categories, which
resulted in decreased average tickets. During 2008, we opened 43 new retail stores in the U.S.,
including three Ink-Paper-Scissors stores (a smaller format store), ending the year with 939 retail
stores in the U.S. Our majority-owned joint-venture in Mexico opened 17 stores during 2008, ending
the year with 83 stores.
Retail segment gross profit margin declined 1.5% of sales to 28.0% of sales for 2008,
compared to 29.5% of sales in the previous year. The gross margin decline was primarily due to the
deleveraging of fixed occupancy costs, which has continued since late-2007, as well as increased
inventory shrinkage cost. For the 2008 back-to-school and holiday seasons, which are always an
aggressive pricing environment, we adjusted our advertising strategies to drive traffic in the stores
without sacrificing overall gross margin levels, and we continued to rationalize and refine our
marketing mix through various media, not just circular advertising. The impact of deleveraging of
fixed-occupancy costs and increased inventory shrinkage costs was partially offset by increased
merchandise margins and a sales-mix shift towards higher-margin office supplies category sales.
Increased fuel prices were mostly offset by fulfillment improvement programs and flexible delivery
scheduling that resulted in fewer miles driven.
29