OfficeMax 2009 Annual Report Download - page 68
Download and view the complete annual report
Please find page 68 of the 2009 OfficeMax annual report below. You can navigate through the pages in the report by either clicking on the pages listed below, or by using the keyword search tool below to find specific information within the annual report.-
 1
1 -
2
-
3
-
4
-
5
-
6
-
7
-
8
-
9
-
10
-
11
-
12
-
13
-
14
-
15
-
16
-
17
-
18
-
19
-
20
-
21
-
22
-
23
-
24
-
25
-
26
-
27
-
28
-
29
-
30
-
31
-
32
-
33
-
34
-
35
-
36
-
37
-
38
-
39
-
40
-
41
-
42
-
43
-
44
-
45
-
46
-
47
-
48
-
49
-
50
-
51
-
52
-
53
-
54
-
55
-
56
-
57
-
 58
58 -
 59
59 -
 60
60 -
 61
61 -
 62
62 -
 63
63 -
 64
64 -
 65
65 -
 66
66 -
 67
67 -
 68
68 -
 69
69 -
 70
70 -
 71
71 -
 72
72 -
 73
73 -
 74
74 -
 75
75 -
 76
76 -
 77
77 -
 78
78 -
79
-
80
-
81
-
82
-
83
-
84
-
85
-
86
-
87
-
88
-
89
-
90
-
91
-
92
-
93
-
94
-
95
-
96
-
97
-
98
-
99
-
100
-
101
-
102
-
103
-
104
-
105
-
106
-
107
-
108
-
109
-
110
-
111
-
112
-
113
-
114
-
115
-
116
 |
 |

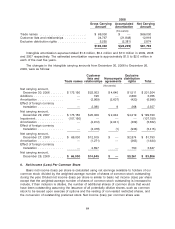
2008
Gross Carrying Accumulated Net Carrying
Amount Amortization Amount
(thousands)
Trade names .......................... $ 66,000 $ — $ 66,000
Customer lists and relationships ............ 34,767 (21,848) 12,919
Exclusive distribution rights ................ 5,255 (2,381) 2,874
$106,022 $(24,229) $81,793
Intangible amortization expense totaled $1.6 million, $5.4 million and $7.0 million in 2009, 2008
and 2007 respectively. The estimated amortization expense is approximately $1.5 to $2.0 million in
each of the next five years.
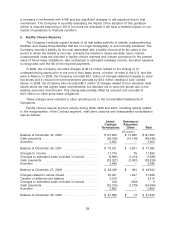
The changes in the intangible carrying amounts from December 30, 2006 to December 26,
2009, were as follows:
Customer Exclusive
lists and Noncompete distribution
Trade names relationships agreements rights Total
(thousands)
Net carrying amount,
December 30, 2006 ....... $173,150 $ 22,003 $ 4,640 $1,511 $ 201,304
Additions ................ — 195 — 2,860 3,055
Amortization .............. — (3,969) (2,607) (420) (6,996)
Effect of foreign currency
translation .............. — 2,080 9 268 2,357
Net carrying amount,
December 29, 2007 ....... $173,150 $ 20,309 $ 2,042 $4,219 $ 199,720
Impairment ............... (107,150) — — — (107,150)
Amortization .............. — (2,912) (2,041) (409) (5,362)
Effect of foreign currency
translation .............. — (4,478) (1) (936) (5,415)
Net carrying amount,
December 27, 2008 ....... $ 66,000 $12,919 $ — $2,874 $ 81,793
Amortization .............. — (1,271) — (363) (1,634)
Effect of foreign currency
translation .............. — 2,897 — 750 3,647
Net carrying amount,
December 26, 2009 ....... $ 66,000 $14,545 $ — $3,261 $ 83,806
6. Net Income (Loss) Per Common Share
Basic net income (loss) per share is calculated using net earnings available to holders of our
common stock divided by the weighted-average number of shares of common stock outstanding
during the year. Diluted net income (loss) per share is similar to basic net income (loss) per share
except that the weighted-average number of shares of common stock outstanding is increased to
include, if their inclusion is dilutive, the number of additional shares of common stock that would
have been outstanding assuming the issuance of all potentially dilutive shares, such as common
stock to be issued upon exercise of options and the vesting of non-vested restricted shares, and
the conversion of outstanding preferred stock. Net income (loss) per common share was
64